Co-author: Darin Briskman
What is an OLAP database?
Online analytical processing (OLAP) tools enable teams and organizations to perform complex analysis on large volumes of data. End users, who can be anyone from business analysts to executives to suppliers to customers, use OLAP products to understand and improve operations, processes, performance, and profitability.
In contrast to transactional (OLTP) databases, the primary purpose of OLAP is to extract actionable insights, drive change, and enable visibility into all aspects of an organization’s performance—both on the macro and micro levels. While there are exceptions, OLAP databases also typically deal with historical data, rather than the near real-time data of OLTP databases.
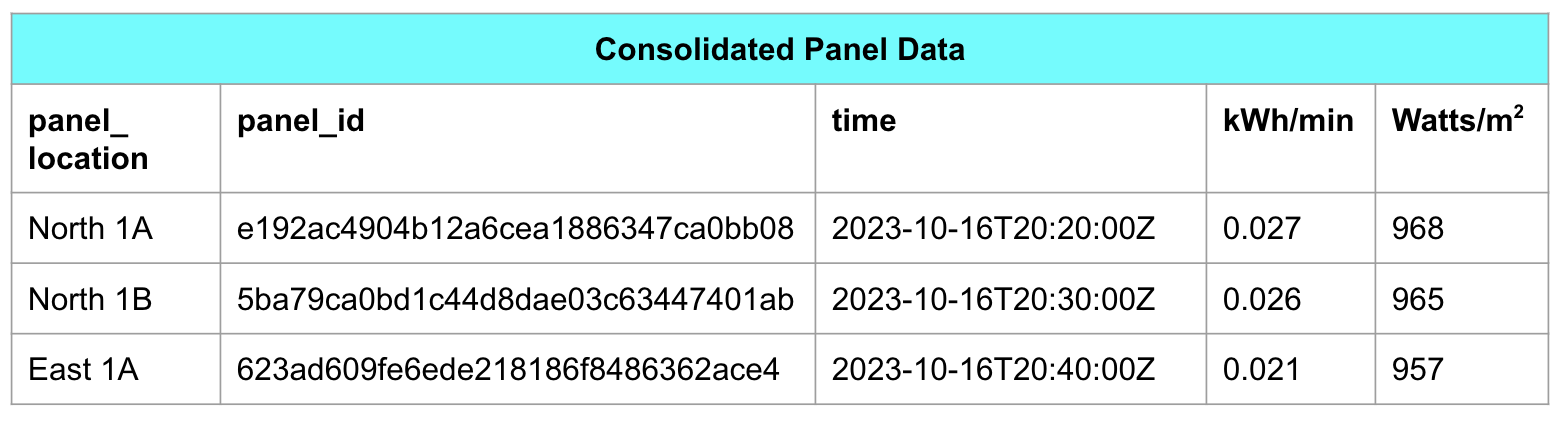
As an example, a solar plant operator wants to assess the efficiency of their photovoltaic panels, ensuring that they’re tracking the angle of the sun across the sky and generating the optimal amount of electricity required. To do so, they can go back into one (or more) year’s worth of data, comparing the performance of panels against the weather conditions and solar availability documented at the time.
With this data, the operator can identify malfunctioning panels or inverters (which convert solar energy into electricity), improve their panel tracking, and ultimately, optimize their electricity output.
There are three main types of OLAP databases.
Multidimensional OLAP (MOLAP) databases, which utilize datacubes (more below) for exploration and analytics. MOLAP databases are ideal for less-technical employees, who may not be familiar with SQL statements or JOINs, to dissect and understand their data. MOLAP databases rely on features such as pre-aggregations and indexing to organize data and ensure fast query responses.
Relational OLAP (ROLAP) databases utilize the tables and relationships of relational databases and the familiarity of Structured Query Language (SQL) for analysis. Due to their architecture, ROLAP databases are both highly scalable and cost effective—by removing MOLAP pre-aggregations, they have a much smaller storage footprint. However, the lack of pre-aggregations also means that queries may take longer to complete.
Hybrid OLAP combines features from ROLAP and MOLAP, storing important data in MOLAP cubes for deep investigation and rapid querying, while keeping the rest in a relational database. This provides the scalability and compact footprint of a relational data architecture alongside the fast retrieval times and user-friendly interface of a MOLAP database.
How do OLAP databases work?
Before an OLAP database can execute any complex operations, it first has to gather data. OLAP products extract data from various sources, such as data lakes, transactional databases, data files (such as CSV or Parquet), streaming services such as Amazon Kinesis or Apache Kafka, and more. Therefore, OLAP platforms must be compatible with a variety of different connectors and other technologies.
Most OLAP databases follow a variation of the extract-transform-load (ETL) process, where data is collected, transformed into a usable composition for analytics, and finally loaded into the database. Cloud-based data architectures usually use a variation of this process, where data is first extracted, then loaded into the analytics database and transformed inside the database (ELT).
After data intake is completed, it has to be transformed into a format or structure (known as a schema) that is suitable for analytics. Transactional systems use schemas optimized to enter data quickly by splitting it into many small pieces, a process called normalization. For analytics, the schema should be optimized to answer questions, or denormalized.
Normalized data
The same data, denormalized
At this stage, data should also be cleaned of “noise,” which includes missing fields, cloned values, errors, and outliers—each of which can skew the results of any analysis.
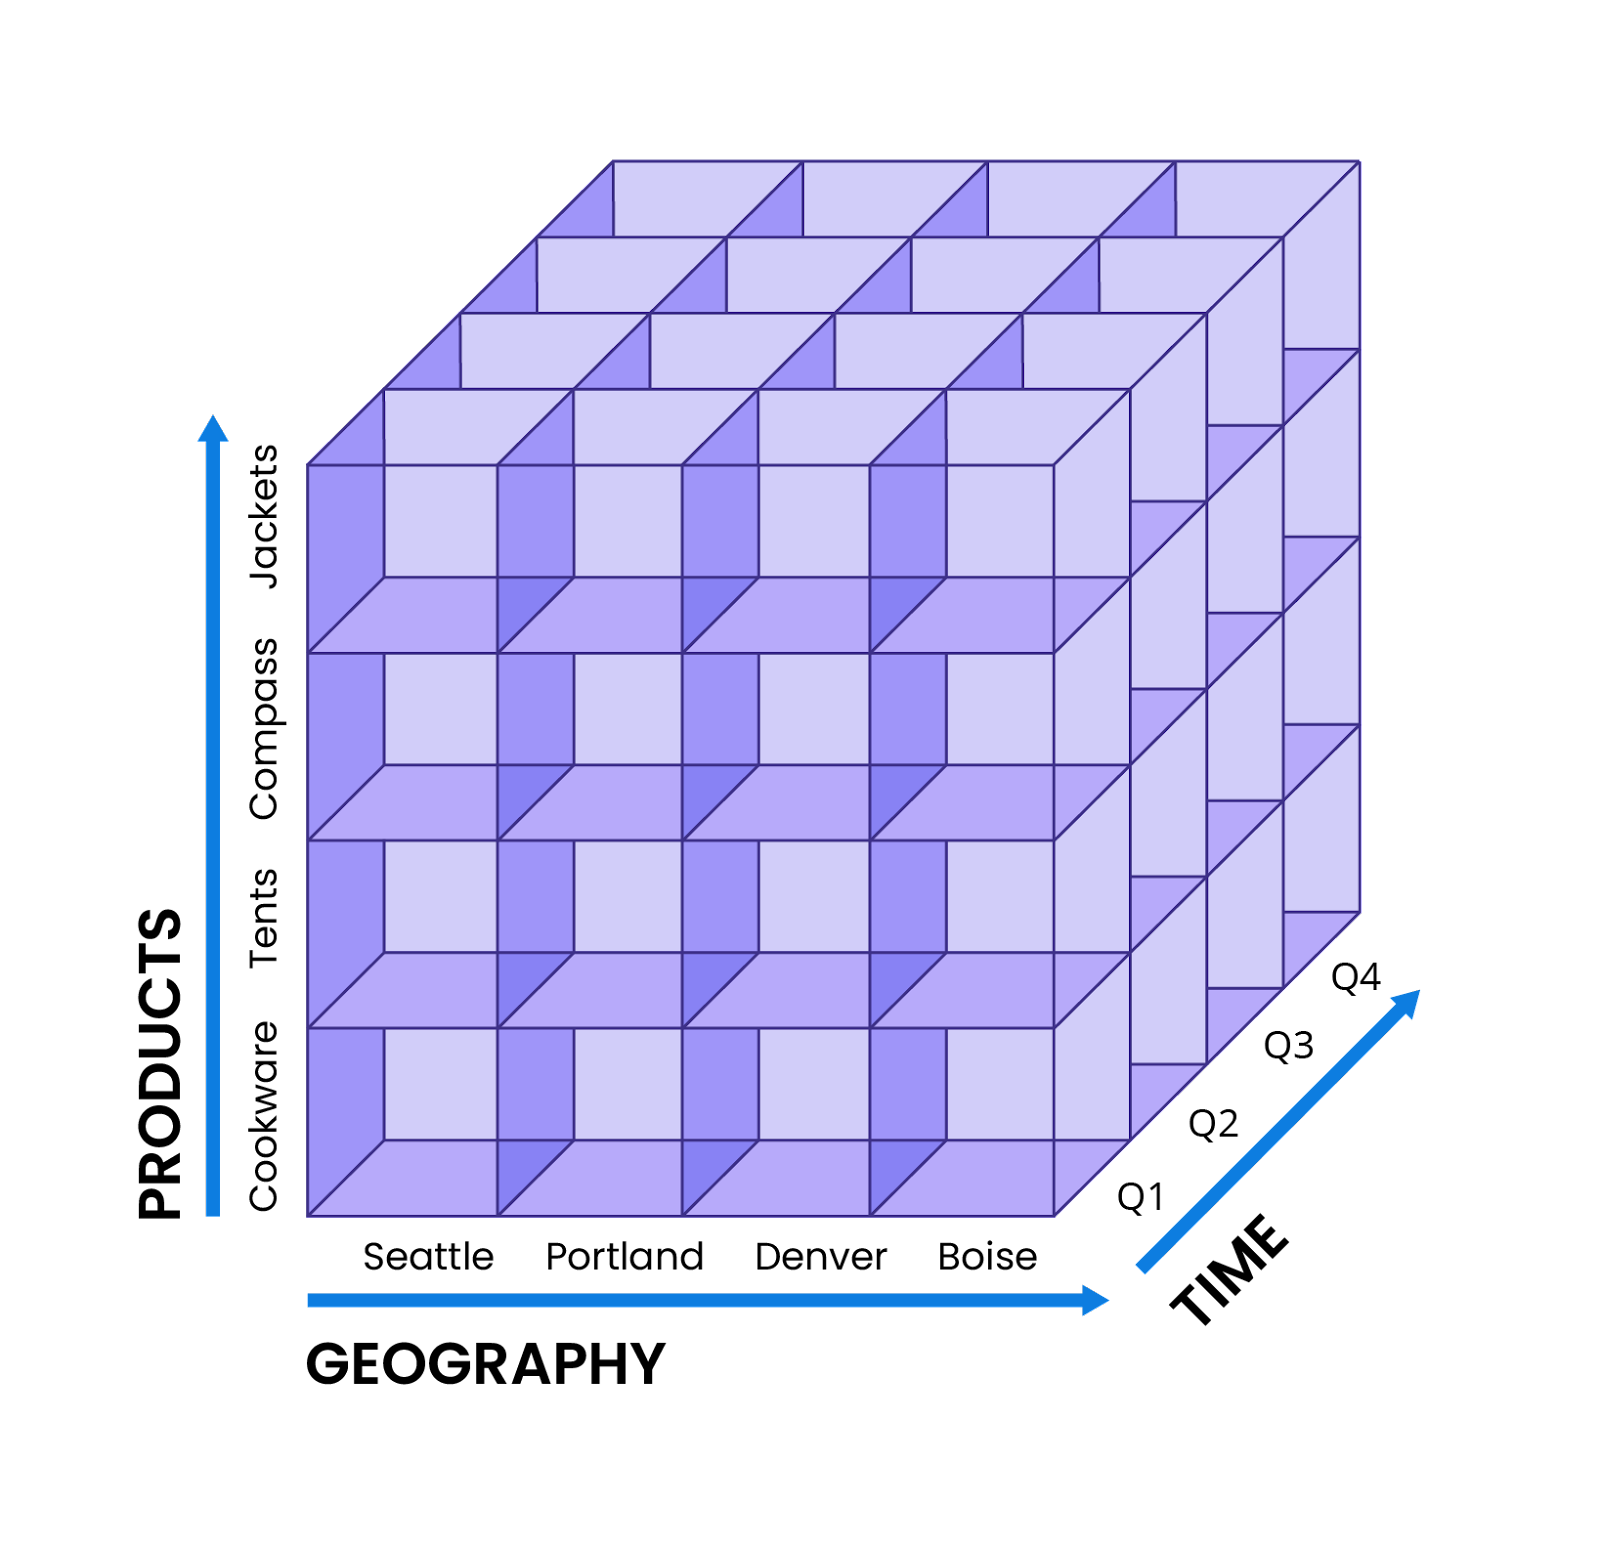
After data is loaded into an OLAP database and transformed to the right schema, analytics can begin. One popular method of investigating data is through a data cube, which is more of a framework for executing multidimensional analysis than an actual 3D object.
For example, an analyst at an outdoor retailer needs to create a yearly sales report. To begin, the analyst might select three categories for the data cube’s axes: the highest-selling products across their entire catalog, the most successful stores, and quarterly sales numbers. If necessary, the analyst can also add more dimensions, such as year-over-year change or even buyer demographics. The resulting data cube could look like this:
Afterwards, the analyst is now ready to run the five different types of OLAP aggregations: rollup, which compresses and summarizes large volumes of data; drill down, which disaggregates data in more detail; slice, which cuts the data cube along a single dimension for more detail; dice, which isolates multiple dimensions for comparison and contrast; and pivot, which rotates the data cube for a new perspective on data.
To learn more about the data cubes and operations, please read Imply’s introduction to online analytical processing.
What are some common use cases for OLAP?
Because of its ability to unearth trends and insights, OLAP is a versatile tool that is used across many sectors and industries.
Sales and marketing. Teams use OLAP products to analyze sales data, plot out customer journeys, and improve marketing campaigns. OLAP tools can be used to identify and classify potential customers into segments, create patterns of buyer behavior, and fine tune digital ad targeting.
Finance. OLAP is ideal for financial operations, including budgeting, forecasting, and analysis. Users can determine areas of spend, pinpoint wasteful purchases, estimate future requirements, and explore financial data across dimensions including time and geography.
Inventory and logistics. OLAP can help manage supply chains, tracking deliveries and purchases, automatically replenishing low stock, and determining the most profitable products.
Energy and utility management. Analysts use OLAP to analyze energy consumption, chart out consumer trends, forecast future demand, monitor equipment output, and optimize maintenance schedules.
Smart asset management. Whether it’s offices or factories, organizations can analyze data from smart buildings to determine times of peak usage, automate climate control by population, reduce energy costs, and predict future foot traffic.
Site reliability engineering and DevOps. With OLAP, SRE and DevOps teams can comb through reams of data from their digital environment in order to investigate issues, resolve problems before they escalate, restore service outages, and improve operations and processes.
What are the key features of an OLAP tool?
Ultimately, OLAP products are intended to explore large data sets in a flexible, comprehensive manner. Therefore, they will require some combination of the following features.
Multidimensional modeling, or the ability to model data across dimensions and hierarchies, such as time, geography, products, and customers. One example of this is the data cube (mentioned above).
Scalability, to accommodate ever-growing demand and volumes of data. Because OLAP is used to create big picture insights, it has to manage petabytes or terabytes of data generated over the course of long periods of time.
Concurrency, to support highly parallel queries and users. As analytics become more vital to users and organizations, more stakeholders require access to data. At larger organizations, OLAP products may have to contend with hundreds of users running thousands of queries simultaneously.
Support for time series data, which is vital in sectors such as the Internet of Things (IoT). Timestamped data requires specialized features, such as interpolation or gap filling, in order to ensure that there are no missing data values prior to analysis.
Aggregations, such as average, sum, count, and more. These operations are essential for summarizing and reducing the size of data sets, providing statistical insights for reporting and identifying trends, and comparing and contrasting figures to find areas of inefficiency and improvement.
Flexible, ad hoc queries. When faced with “unknown unknowns,” when teams are unclear as to what exactly they are searching for, they have to explore data in an open-ended manner—without pre-aggregating data. This requires significant resources and moreover, an easy-to-use interface that can help users of all skill levels drag and drop or point and click to find answers.
Detailed visualizations, such as bar charts, pie graphs, scatter plots, and heatmaps, to present data in an intuitive, interesting format. Ideally, these visualizations would be interactive, enabling users to zoom in and out and take different perspectives on their data. As a bonus, visualizations should be shareable to facilitate collaboration and better disseminate information.
What are the best OLAP tools for business intelligence?
Given the vast number of OLAP products available today, buyers may have difficulty choosing a solution to meet their needs. Here are several options to look at.
Apache Druid
Apache Druid is the database for speed, scale, and streaming data. Designed to support the rapid retrieval times and concurrent traffic of transactional databases, as well as the intensive aggregations and huge datasets of analytical databases, Druid excels at the requirements of real-time analytics. Imply, the company founded by the creators of Apache Druid, also provides an entire product ecosystem built on Druid.
Druid is natively compatible with Apache Kafka and Amazon Kinesis, the two most popular streaming technologies available today. This provides an easy way to ingest real-time data with minimal configuration. Events are also ingested exactly once, ensuring that they are not duplicated, and are available for queries and analysis immediately on arrival.
Druid is also highly scalable, assigning different functions (such as cluster control, query, and storage) to separate node types that can be added or removed as needed. After nodes are scaled up or down, Druid will also automatically retrieve data and workloads from deep storage and rebalance them across the remaining (or added) nodes.
In addition, Druid can quickly complete queries, even given high query traffic and large user volumes. Queries are executed using the scatter/gather process, being divided up into pieces, sent to the relevant data node for scanning, and finally reassembled by broker nodes—a process that takes milliseconds even on large data sets. To further accelerate the process, Druid also divides data into segments, which can be scanned simultaneously by multiple queries—rather than being locked and scanned by one query at a time.
To learn more about how Druid was designed to facilitate fast, subsecond queries under load and at scale, read the Druid architecture whitepaper.
Druid also supports time series data with features like automatic backfill, which will organize late-arriving data into the proper place without human intervention. Druid also includes interpolation and gap filling, which use a variety of methods to fill in missing values and ensure that time series data is ready for analysis.
Because Structured Query Language (SQL) is so common, Druid also includes a layer that automatically translates SQL queries into Druid native queries. This layer translates most common SQL expressions, enabling users to work with their language of choice, and removes the need to learn yet another query language.
Lastly, Imply also created Pivot, an intuitive GUI for building shareable, interactive visualizations and dashboards. Users can drag and drop, zoom in or out, and investigate data in depth with a few clicks of the mouse—Pivot will automatically handle any required operations (such as SQL queries) on the backend.
Today, Apache Druid is highly rated on G2, the leading peer-to-peer review site for business technologies. In addition, Druid is ranked at 99 on the DB-Engines Ranking—a 129-place improvement from its position last year.
Today, Druid is used by a number of leading organizations in both its open source and paid forms (via Imply). Some notable names include:
Electric adventure vehicle manufacturer Rivian, which utilizes Druid to power real-time analytics for downstream applications, including remote diagnostics and predictive maintenance.
Streaming media giant Netflix uses Druid to monitor user experience across 300 million devices, four major UIs, and multiple types (tablet, phone, smart TV, desktop). Netflix then uses this real-time data to consistently deliver a world-class entertainment experience.
Telecommunications leader NTT uses Druid to power their analytics stack, providing ad-hoc exploration to users of all technical abilities. Their environment ingests over 500,000 events per second, stores over 10 terabytes of data in each Druid cluster, and requires significantly fewer resources to ingest, store, and query data in contrast to time-series databases.
International travel platform Expedia Group uses Druid as the foundation for their internal self-service tool, which empowers users to segment travelers for more precise, effective marketing and advertising. With Druid, they reduced query latency from 24 hours to under five seconds, were able to execute DataSketches at ingestion for fast approximations, and support dynamic criteria across massive datasets.
Comparison: Apache Druid and Snowflake
In many ways, Druid and Snowflake have enough differences that a side-by-side comparison is not a 1:1 analogy. Instead, while there are overlaps between the two databases, they are used very differently.
Snowflake was created as a cloud data warehouse—which, despite its resemblance to real-time analytics databases like Druid, has some differences. Data warehouses are ideal for regular reporting, at intervals such as daily, weekly, or monthly, usually in areas where factors such as speed or concurrency are less important. This means that Snowflake can execute complex analytical queries on massive datasets, though without subsecond response times.
Snowflake’s compute resources are called virtual data warehouses, and are containerized for easy scaling. This provides flexibility in costs—you’ll only pay for what you use—but enacts a performance penalty, as containers require time to spin up. Because of this containerized, partitioned design, Snowflake is a cloud-only product, without options for on-premises or hybrid deployments.
By default, Snowflake supports up to eight concurrent queries in each virtual data warehouse, though Snowflake can support high concurrency by deploying more warehouses. However, this means that costs will scale in a linear fashion: 20 warehouses to support 160 parallel queries will bring a 20x increase in expenses.
As a data warehouse, Snowflake is also optimized for batch processing of historical data rather than streaming. It also utilizes a relational data model that is compliant with ANSI SQL (the most commonly used SQL dialect today) and includes several APIs and other tools to more easily model data.
Ultimately, if a use case lacks the time pressures of real-time data and analytics, then Snowflake can be a suitable option. These use cases would be more traditional business intelligence and reporting, where deadlines are both longer and more predictable, and both user volumes and query rates are low. Some use cases, such as security and IoT, may not be a fit for Snowflake, given requirements for data to be stored fully or partially in on-premises, physical servers.
However, where Druid excels is performance. Druid is ideal for high-speed, low-latency use cases. If there are many users or applications running multiple queries per second on massive datasets—and they need answers immediately—then Druid is the solution of choice.
There’s also another alternative: using both Snowflake and Druid in the same environment. In fact, this is the case for many application architectures, which utilize Snowflake for long-term analysis and reporting, and Druid for rapid, real-time use cases.
To learn more about Apache Druid and Snowflake, read this blog or this comparison chart.
Comparison: Databricks and Apache Druid
Founded by the creators of Apache Spark in 2013, Databricks is a cloud-native analytics database for large volumes of data. As a data lakehouse, Databricks combines the flexibility of data lakes with the structure, performance, and governance of data warehouses. For instance, Databricks stores the raw, unprocessed data in its native format (whether it’s structured, unstructured, or semistructured) like a data lake, while supporting the transactional create read update delete (CRUD) operations and analytical workloads of a data warehouse.
Databricks enables users to work jointly through interactive notebooks, visualizations, and other shared tools. This provides a high degree of concurrency, as users can simultaneously edit and execute across multiple notebooks, running code, querying data, and testing machine learning all at once.
Databricks also scales similarly to Druid. Clusters can automatically add or remove nodes to meet demand. Databricks also includes Enhanced Autoscaling, a capability that will allocate resources without impacting pipeline latency.
Because it is based on Spark, Databricks also includes all of Spark’s ancillary features, specifically its libraries and APIs, facilitating operations on massive datasets. Data can be ingested or integrated from various external data sources, such as data lakes, databases, streaming platforms, and more, as Databricks is compatible with a wide range of connectors and other APIs.
Due to its collaborative features, Databricks is often used for several components of the machine learning process. Its notebooks and libraries are an excellent medium through which data scientists can explore, clean, and prepare data for training, especially in a collaborative manner. Machine learning models can also be developed through a wide range of specialized libraries, and the relevant code written in interactive notebooks. Afterwards, these models can be deployed as REST APIs or batch jobs, monitored for continued accuracy, and corrected for any possible drift that may arise.
As with Snowflake, determining when to use Druid and when to use Databricks is a matter of requirements. For instance, in areas like AI and machine learning, Databricks is a more versatile solution because it provides the ability to write code in notebooks and ML-specific features, such as automated model selection and hyperparameter tuning.
Because of its notebooks and concurrency, Databricks is a good match for coordinating work across teams and departments. Databricks also has an advantage in complex extract transform load (ETL) pipelines, where data has to be pulled from different sources, processed into a compatible format or structure, and loaded onto a database for storage and analysis. Databricks is also more of a generalist than Druid, as it can execute a broader range of general purpose tasks such as data warehousing and batch processing.
The architecture of Databricks is designed for high scalability, but not for high performance nor high concurrency. It’s not suitable when you need subsecond query times or many queries happening at once, while Druid is able to deliver subsecond high concurrency queries with datasets of any size.
Druid is suitable for part of the ML training process, specifically discovery, rapid inference, and model accuracy monitoring. In this sense, it is more of a specialist—its subsecond response times are invaluable when speed is of the essence, such as for cybersecurity, fraud detection, or instant personalization.
In fact, anything that requires real-time analytics for fast-moving (usually streaming) data will be better served by Apache Druid, given features like exactly-once ingestion and query on arrival—crucial for leveraging streaming data at speed. One example is IoT devices such as on communications-based train control (CBTC), which utilizes sensor data to provide visibility into train operations, maintain safe operating conditions, and alert on any anomalies. As a real-time use case involving massive datasets and streaming data, CBTC is an excellent fit for Druid, rather than Databricks.
Druid is also a better match for any use cases that may require time series data, such as for healthcare monitoring or financial analysis. Its built-in tools, such as interpolation and automatic backfill, can help clean time series data of noise, prepare it for analytics, and simplify the developer experience for challenges such as late-arriving data.
Comparison: Oracle and Druid
Oracle was one of the first relational database management systems (RDBMS) that gained widespread adoption and even a spot in the popular imagination. Founded in 1977, immediately on the heels of the pioneering work done by computer scientist Edgar F. Codd on RDBMS, Oracle has since grown to the third-largest software company worldwide. Its primary customers are large enterprises, with products for cloud software, customer relationship management (CRM), and more.
Oracle stores data in tablespaces, storage units that consist of one or more data files (which themselves consist of data stored on disk). It utilizes a relational data model comprised of tables with rows and columns, enforcing data integrity and relationships through constraints, keys and indexes. As such, Oracle uses SQL to query and manage data, and also supports other variants for more complex operations like triggers or custom functions.
Oracle is capable of supporting a degree of concurrency through multi-version concurrency control (MVCC), a mechanism that enables simultaneous transactions without them interfering with each other. This ensures read consistency and prevents dirty reads, phantom reads, and non-repeatable reads.
In contrast to Druid, Oracle’s primary offering is also a transactional database rather than an analytical one. Therefore, it’s designed for Atomicity, Consistency, Isolation, and Durability (ACID), to maintain the reliability and continuity of transactions. While their product catalog does include data warehouses and analytics, such as Oracle Analytics Cloud, their core is built around a transactional database. While they’re ideal for running daily business operations, it’s not optimized for the demands of complex analytics on large datasets—even less so if these analytics must occur in real time.
Perhaps the biggest disadvantage of Oracle is vendor lock. Despite their extensive product family, some customers may wish to leave Oracle and opt for alternatives—which is very difficult to do. For one, Oracle technologies are primarily proprietary ones; unlike databases like Druid (or indeed, any Apache project), Oracle was never designed to be open source in the first place. In addition, many Oracle systems are tightly integrated with each other, setting up compatibility issues and migration difficulties for any replacement platforms.
Oracle is also infamous for their complex, byzantine licensing and pricing models. Rather than a simple, pay for what you use plan, Oracle may charge by processor, by user, or some combination of criteria. This leads to confusion, and more importantly, surprising charges that may be difficult to dispute or reduce.
The typical Oracle user is an enterprise with lots of legacy systems, often built by employees who are no longer with the organization. At the same time, the inertia built up by decades of use and expertise in Oracle’s ecosystem makes any transition a difficult task, fraught with new training and onboarding, the potential to break plenty of small features or bits of code, and ultimately, a lot of overhead and employee hours.
In contrast, Druid users tend to be younger companies and organizations with fewer legacy systems. That’s not to say that enterprises don’t use Druid—plenty do—but they likely are less reliant on established vendors like Oracle for their core functions. Skunkworks or tiger teams at large corporations may also be drawn to Druid for its flexible deployment options as well, particularly if they are building a prototype or a separate application that is disconnected from older software. In this case, they can choose between running their own open source Druid clusters or going with an Imply option, such as transitioning directly into cloud-based Polaris or splitting the difference between on-premises servers and the cloud with Hybrid.
Why choose Apache Druid?
Apache Druid is the database for for speed, scale, and streaming data. As such, it was created to address the challenges of ingesting streaming data through software such as Apache Kafka or Amazon Kinesis, and to structure data for subsecond response times under load.
Druid isn’t a transactional database or a generalist analytics database, but it does excel at real-time analytics. As data increases in speed and volume, end users—whether it’s organizations or applications—have to act immediately, which is where Druid comes in. By executing fast, complex analytical queries on large volumes of data for many parallel users, Druid lends itself to challenges such as fraud prevention, industrial safety, healthcare monitoring, instant personalization, and much more.
Imply also features paid products including Polaris, a database-as-a-service and the easiest way to get started with Druid. Another valuable product is Pivot, an intuitive GUI for building rich, interactive visualizations and dashboards for either external and internal use.
To learn more about Druid, read our architecture guide.
To learn more about real-time analytics, request a free demo of Imply Polaris, the Apache Druid database-as-a-service, or watch this webinar.