An introduction to the Internet of Things
In an increasingly digital world, data drives innovation within all organizations, from large Fortune 100 corporations or government institutions to the smallest startups. By 2030, analysts predict that the global IoT market will be worth over $3.4 trillion, a compound annual growth rate (CAGR) of almost 26 percent.
As a result, smart IoT devices—connected to each other and the cloud through WiFi, Ethernet, and other technologies—are a key competitive advantage. Now, teams can use the power and connectivity of the cloud to collect, organize, and analyze IoT data to better optimize performance of physical hardware and assets, from buses to assembly lines to solar panels.
As IoT devices become more commonplace, companies must use databases that are suitable to meet the challenges of scale and speed. IoT data comes in massive quantities: when each sensor transmits hundreds of events an hour, compounded across a large network, it becomes millions (or billions) of events per hour.
Here are five features that every IoT database must have.
Stream-based ingestion
Since IoT data arrives at speed, streaming (usually Apache Kafka® or a similar technology) is the preferred method for ingesting IoT data. Therefore, any IoT database must be able to ingest streaming data at the speed at which it arrives—ideally without the need for additional connectors or workarounds, which creates more work for engineering teams.
Fast query performance
Speed is also needed for IoT analytics. Often, insights are time sensitive and highly perishable, which means events must be triggered quickly and automatically. As an example, upon detecting a train’s location or a temperature spike on an assembly line, an automated system only has seconds to respond (either by braking a train or activating fire suppression countermeasures). Any delays could have catastrophic consequences.
Flexible schema
IoT data is extremely diverse, and arrives in a variety of formats, such as temperatures, distance in meters or feet, angles, and more. To accommodate such data, a database should either be schemaless or have the ability to identify schema upon ingestion. This will reduce the amount of work required of employees, such as the time that a database administrator has to put into data modeling.
Time-series optimized
Any prospective database also needs to be able to handle time-series data, because IoT data is simply another form of time-series data—it is gathered over a period of time and individual events are time stamped. This means that any IoT database needs to be able to organize, aggregate, and query by time-based filters (hours, days, months, or more). This is essential not only for retrieving data, but also for outlier detection, which builds patterns out of data and flags any anomalies for human review or automated triggers.
Fault-tolerant
Lastly, any IoT database has to be highly available, reliable, and scalable. For example, an IoT solution that creates an external user interface will require a database that can perform under load, as its data is queried, aggregated, and accessed by hundreds of customers simultaneously through dashboards, business intelligence connectors, and other tools. This IoT provider also cannot risk outages that can bring down the flow of data, or an unscalable architecture that requires plenty of manual work from in-house teams.
Use case: solar power
IoT data is critical to many aspects of solar energy, from generation to operations to consumer usage. As an example, large-scale solar power plants need to ensure that panels track the path of the Sun as it travels across the sky in order to generate maximum electricity, and to monitor the performance of components such as photovoltaic inverters.
Solar power also comes with unique challenges. Due to their size, many utility-scale solar installations are located in remote areas, far away from population centers and easy network access. Therefore, there can be delays between when a sensor creates an event and when the company receives the data—anywhere from minutes to months—complicating any efforts to ensure data continuity and consistency.
In addition, the rise of solar has reimagined the relationships between utilities and customers. Some customers generate their own power, only relying on the grid to fill the gap during off-peak periods or during unfavorable weather conditions. This means more customers accessing data through smart meters or user portals, creating higher traffic with more queries.
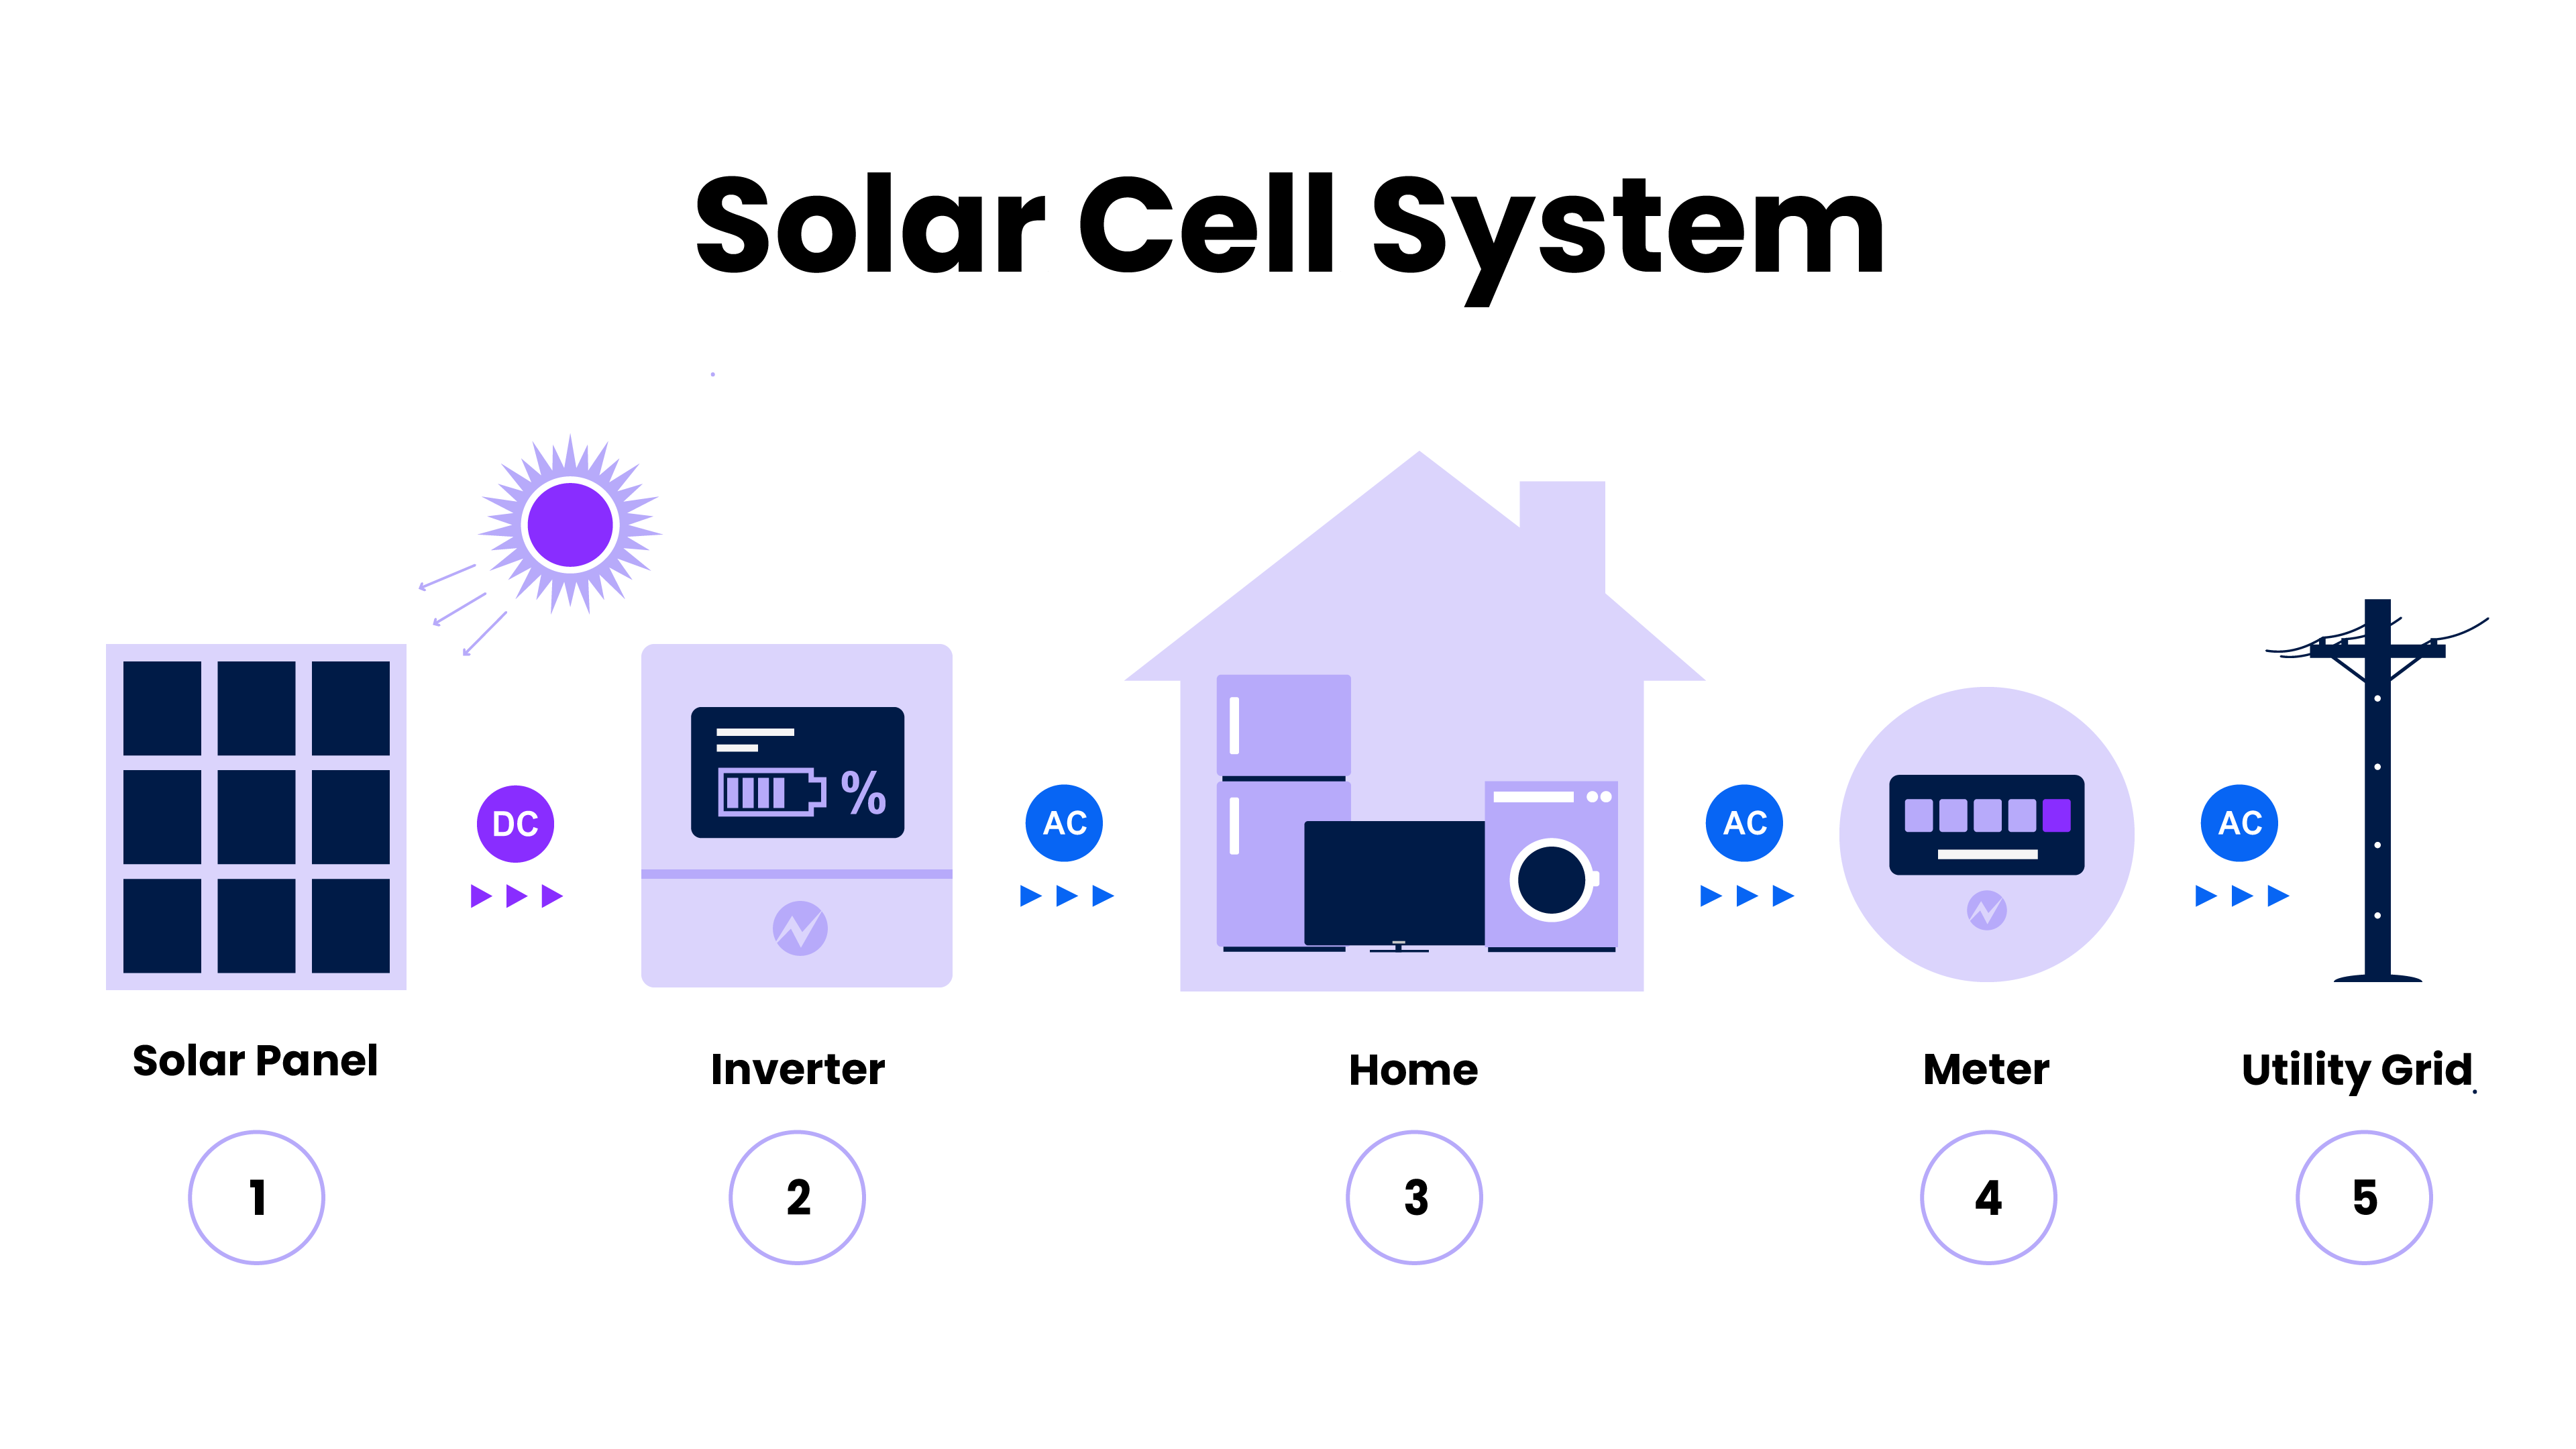
An example of a residential solar energy system, with solar panels, inverters, meters, and utility connection.
Why Druid for analyzing solar energy management?
Scalable. With accelerating environmental and economic drivers, solar energy is growing exponentially. Druid can scale with demand, going from megabytes to petabytes of data—and everything in between.
Durable and resilient. Druid provides peace of mind through its deep storage layer, which serves as a continuous backup—so that data is always available. Druid is also designed to operate continuously, rebalancing workloads and ensuring high data availability even when individual nodes fail or go offline.
Immediately accessible. Druid provides immediate query-on-arrival. While some other databases require events to be ingested in batches and persisted before they can be queried. Druid ingests each streamed event directly into the database memory, where it can be queried right away—so plant operators or home customers can access time-sensitive insights without delay.
Concurrent. Whether it’s utility engineers or home users, any renewable energy application will support a high rate of parallel users fielding simultaneous queries. Druid can accommodate this influx of traffic without compromising query speed or application performance.
Consistent. Druid’s exactly-once ingestion also ensures that data only appears once to ensure accuracy and consistency. For solar energy projects with large numbers of devices across many different locations, duplicated events can introduce confusion into processes and errors into analytics.
Optimized for time-series workloads. Druid ingests and organizes data into segments, files which can comprise up to several million rows of data. Segments are then partitioned by time, which simplifies time-based queries (such as a WHERE query that filters data by the previous year to build a pattern of trends for analysis). As such, Druid can also backfill late-arriving data without human intervention—an important consideration for devices at far-flung energy installations which experience connectivity issues and only transmit data periodically.
Customer example: a leading solar company
Founded in 1981, this German company is a leading producer of high-quality photovoltaic systems for grid, off-grid, and backup operations. In 2022, they earned €1.07 billion of revenue, an 8.4 percent increase from the previous year.
As part of its expansion, this company provides energy analytics and data to both utility and residential customers. Data from hundreds of thousands of inverters are collected, analyzed, and delivered in real time, empowering users to monitor performance, optimize operations, and ensure effective electricity production.
Their customer-facing user interface was initially built on Microsoft SQL Server—and soon encountered growing pains as their customer base grew rapidly. For this project, SQL Server offered limited scalability, unable to scale past 60,000 photovoltaic plants and two million devices (both controllers and servers). As their network grew rapidly, expanding by over ten thousand plants per month (and tens of millions of devices overall), SQL Server could not provide the scalability needed, resulting in a less-than-optimal user experience and slow data retrieval. Some queries would simply never complete.
To complicate matters, SQL Server required significant operational overhead. Not only did the company have to run multiple instances in order to accommodate all their client installations, they also had to manually scale the node or patch their in-house middleware. For instance, company engineers had to collect data from operational systems, copy or modify it, and input it into another SQL Server instance for analysis, business reports, and logistics.
To provide a better solution, this solar company switched to Apache Druid for their database, deploying their Druid clusters privately and monitoring and managing them with tools from Imply including Clarity and Manager. The level of abstraction provided by both Druid and Imply Manager helped engineers automate rote tasks, such as configuring, provisioning, and scaling instances.
In total, this company generates up to 1 GB of data per day and nearly 132 billion rows per month, retaining data for up to one year. After their user portal migration is complete, it is anticipated that Imply will be able to receive up to 50 million daily events from 700,000 solar plants, while accommodating 200,000 logins. Simultaneously, their portal will be able to support up to 100 concurrent queries per second, each with a subsecond response time.
Druid also helped resolve issues related to this company’s late-arriving data. When data is delayed and is ingested minutes or months after it was generated, Druid seamlessly stores the tardy data in the relevant segment, sorting it by date of generation rather than ingestion—removing any need for humans to intervene and manually revise the dataset.
Going forward, they are also assessing the use of Druid and Imply to provide advanced aggregation and more granular metrics for grid operators, a use case currently fulfilled by SQL Server. Using Druid and Imply, the team hopes that they can provide deeper, more detailed insights through enabling operators to isolate data by variables such as postal codes or even individual streets.
With Druid, their user portal can now complete all queries quickly and feature more flexibility and versatility in exploration, enabling users to filter and group data by a wide variety of dimensions. By reliably delivering subsecond queries and interactive dashboards, their teams provide customers an effective means of optimizing their solar usage—enabling their company to grow with demand and play a key role in decarbonization.
Use case: smart building management
Today, changing economic and environmental conditions have led to a sea change in infrastructure and (office) building management. As costs for electricity, maintenance, and labor increase, governments have created new regulatory requirements for energy-efficient (office) buildings.
Thanks to advances in IoT technologies, smart office buildings are becoming increasingly important in adhering to legislation and cutting expenses for property owners and tenants alike. These platforms provide a deeper degree of control, managing electricity usage, heating, and cooling in office buildings or ensuring the smooth, safe operation of assembly lines and factories.
By nature, smart building applications need to be always available, as facilities must be monitored for emergencies, such as fires, leaking pipes, or electric outages. Organizations may also have to deal with huge amounts of data: for instance, a research lab may need to sample temperatures every second across hundreds of Petri dishes or incubators—generating millions of events per day.
Why Druid for smart assets?
Scalable. Druid can scale elastically to meet the demands of any smart asset application, and in a cost-effective manner. Alongside Druid’s unique architecture, capabilities like pre-aggregation, roll-up, and compaction make massive volumes of data manageable and easy to query.
Durability and resilience. Any downtime can have serious consequences, from assembly lines shutting down to cascading failures in critical facilities such as server farms or hospitals. By design, Druid is extremely resilient, continuously backing up data, restoring both workloads and data in case of node failure, and reducing the possibility of data loss or downtime.
Concurrency. Druid supports large numbers of parallel users and queries, returning results in milliseconds regardless of the volume of activity. Druid accelerates queries with a scatter/gather approach, using parallel processing for fast results even when there are many queries underway.
Customer example: Thing-it
A leading provider of smart office building management software, Thing-it enables organizations to manage every aspect of their offices, including desks, access control, catering, parking, and more. Headquartered in Germany, Thing-it counts 10 percent of companies listed on the German DAX Index amongst its customers, and recently received its WiredScore accreditation in recognition of its leading role among smart asset technologies.
Previously, Thing-it’s environment ingested building data in batches through Amazon SNS, after which it would be processed with an Amazon Lambda function before being moved into MySQL. Finally, data in MySQL would be queried through a REST API before being visualized in customer-facing dashboards built on AngularJS.
While querying the latest data was simple and fast, the Thing-it team wanted to improve the speed and consistency of aggregations on historical data. And because their interactive dashboards depended on the speed of queries and aggregations, any slowdowns would affect dashboard performance.
Before and after: architecture diagrams.
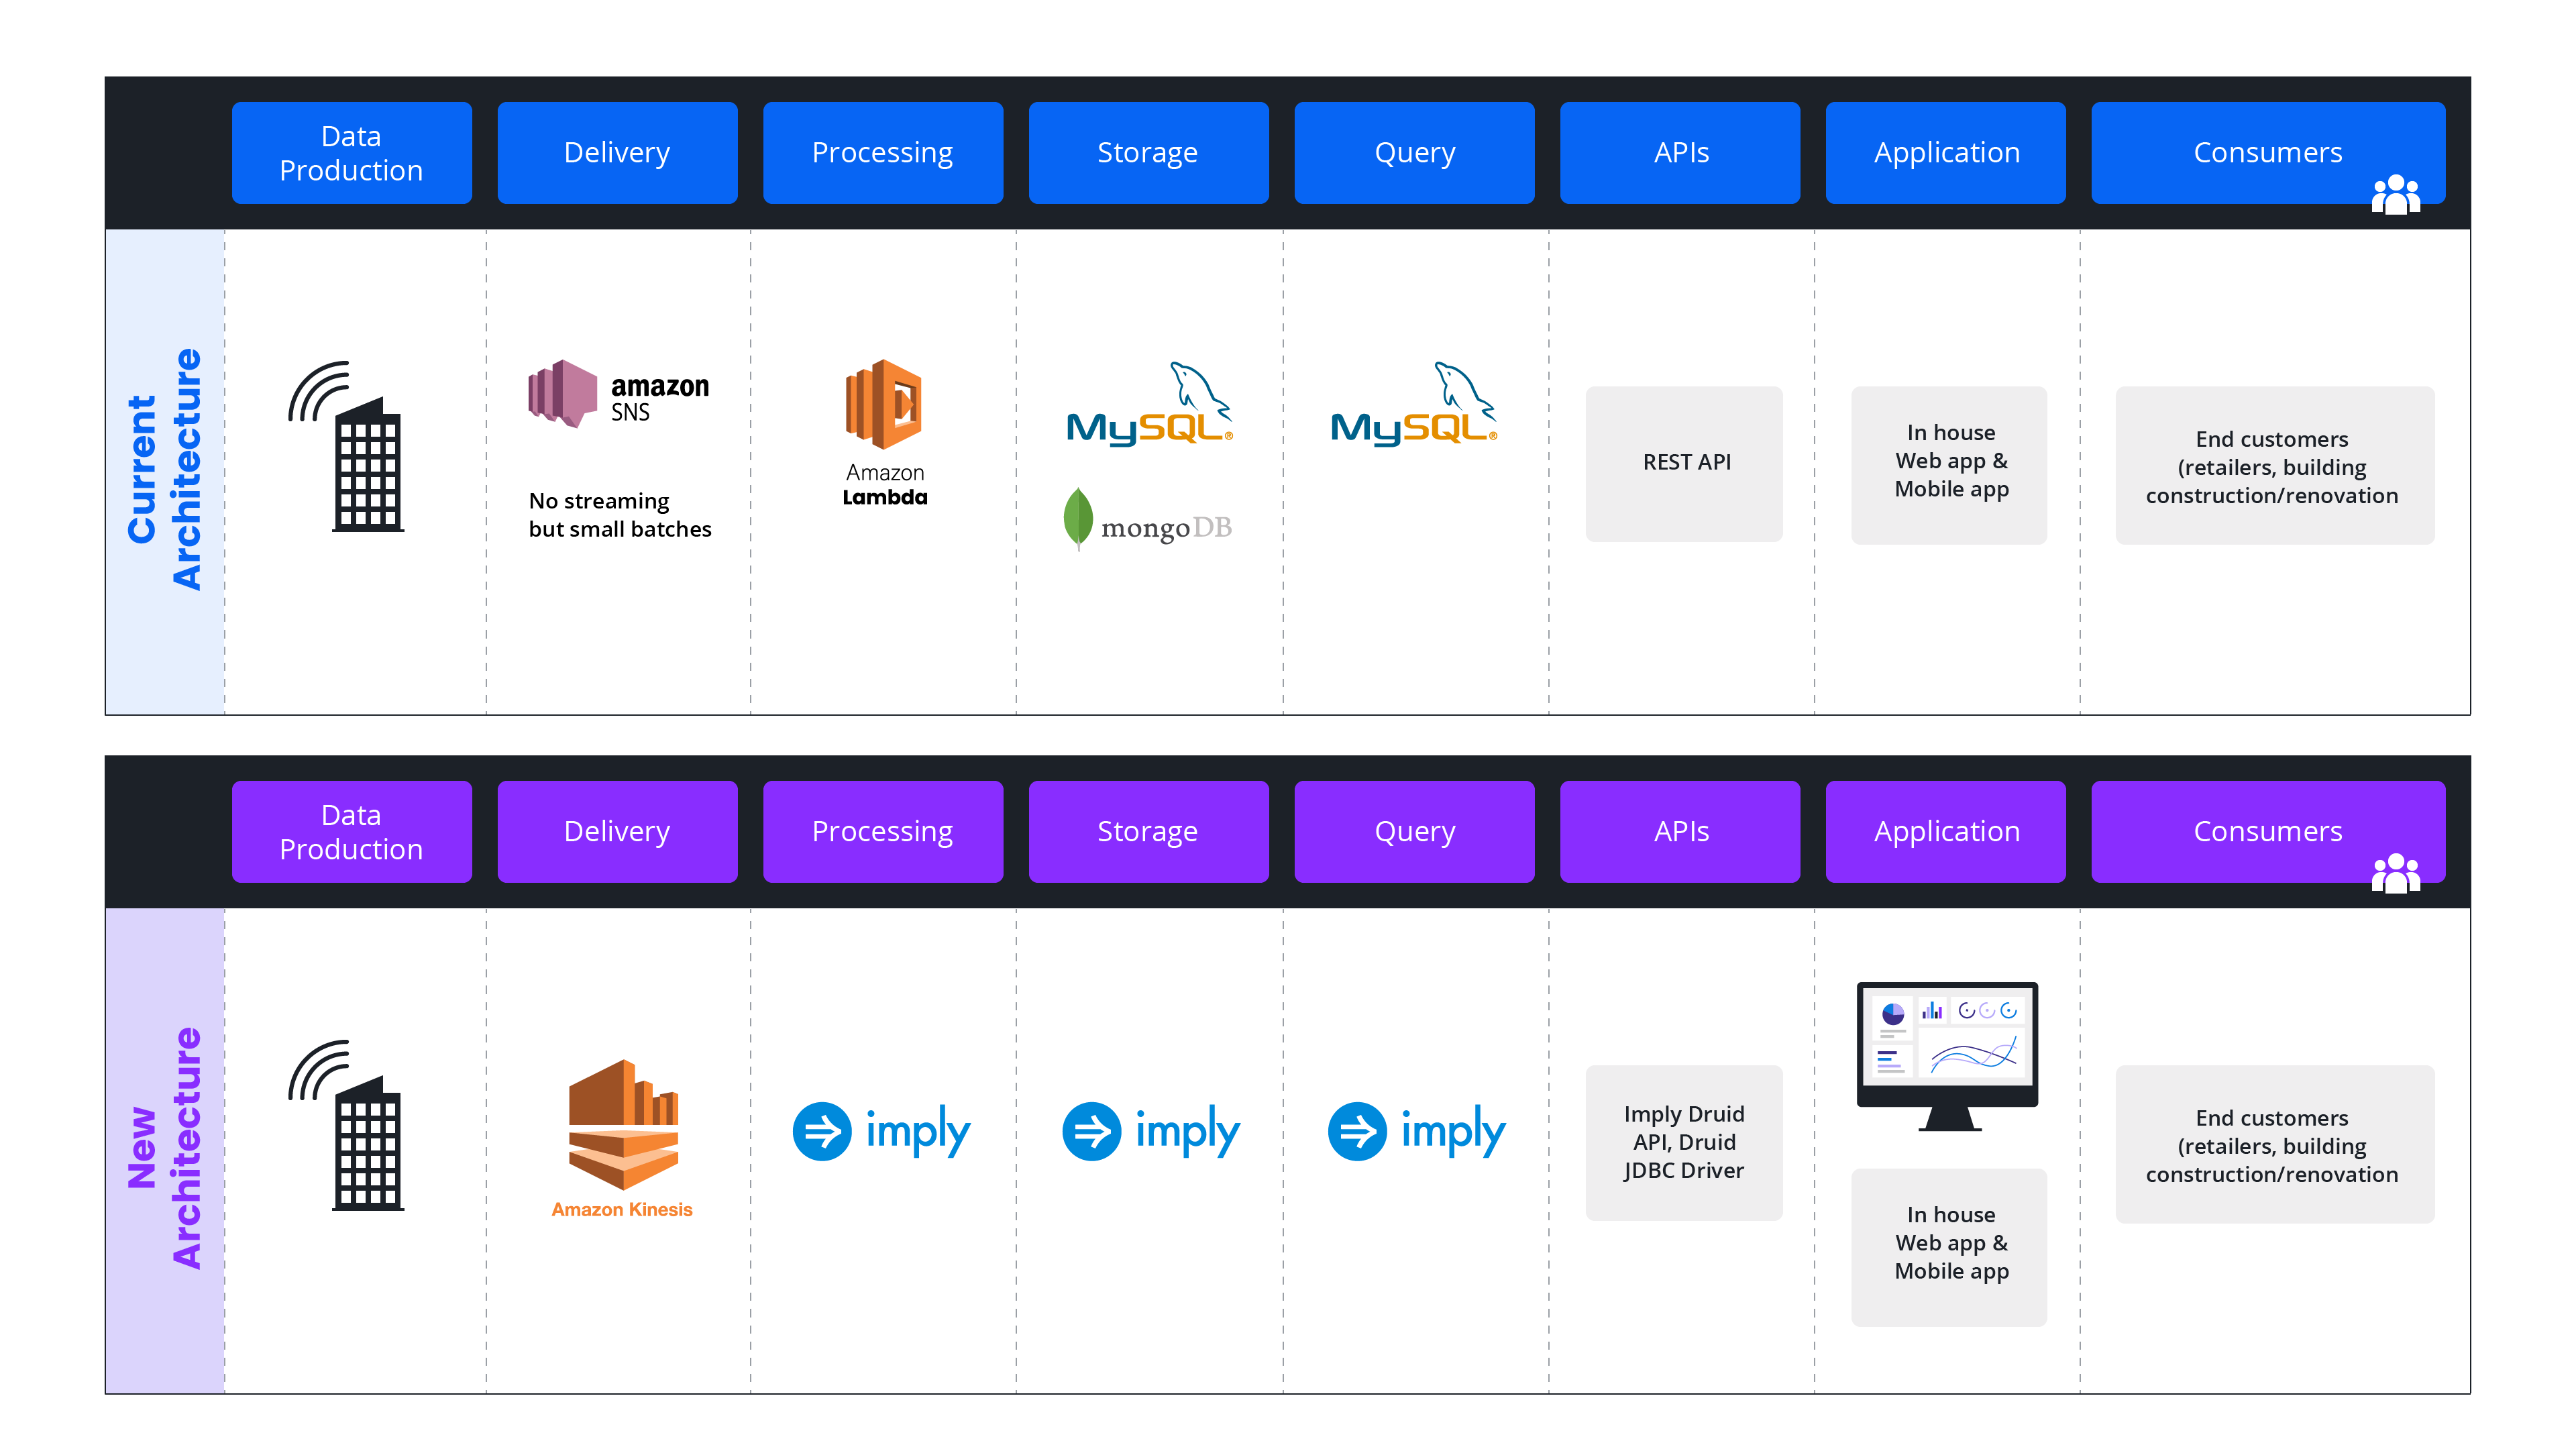
Further, MySQL was limited in its ability to scale to accommodate new users or use cases. Despite these limits, Thing-it was already ingesting 100 MB of daily data per customer (up to 1 TB per month) through Amazon SNS. To complicate matters further, MySQL required a separate database schema for each customer, which only increased friction and engineering overhead.
In the early days of Thing-it, MySQL had provided a highly optimized, fast database for building an initial product, attracting new customers, and generating traction. But as the company grew, MySQL became increasingly expensive and unwieldy to operate. It became clear that in order to keep pace with the high rate of customer expansion, Thing-it needed a scalable database that could quickly retrieve data.
With Druid, Thing-it was able to reinvent their data architecture, removing Amazon SNS and Lambda, replacing them with Amazon Kinesis and Druid. By transitioning to streaming data through Kinesis, Thing-it greatly increased its scale, generating up to 2 billion rows per month. As a bonus, Kinesis is natively compatible with Druid, requiring no additional configurations or connector to operate.
After upgrading to Druid, Thing-it reduced their database spend by 50 percent and accelerated their query speeds to 72 milliseconds, a significant improvement. The slowest queries topped out at 300 milliseconds with an impressive success rate of near 100 percent.
While the Thing-it team considered using open source Druid, they instead preferred to abstract away the work of hosting, provisioning, and running Druid on their own—choosing to partner with Imply for support and monitoring. One service they use is Imply Clarity, which provides comprehensive visibility into the health and performance of Thing-it’s Druid clusters.
Overall, the Thing-it team concluded that, had they stayed with MySQL, their operating costs likely would have grown proportionally to their data. Using Imply, however, Thing-it was able to keep expenses constant, even as data volume grew by almost 300 percent. Going forward, Thing-it is evaluating the use of Pivot, the Imply GUI for easily creating and embedding dashboards and visualizations in customer-facing applications.
Customer example: a leading multinational manufacturer
Headquartered in the United States, this company designs and produces advanced safety, building, and aerospace technologies. A member of the Fortune 100, this company employs approximately 97,000 people worldwide and enjoys a market value of over $100 billion.
Their smart asset management platform is a single, comprehensive solution for the safety, security, and productivity of physical assets. This platform ingests and aggregates data from warehouses, office buildings, and assembly lines, providing real-time IoT data so that users can monitor performance, alert on anomalies, and reduce operating costs for heating, cooling, and more.

Recently, the company debuted a new project to capture sensor data (such as temperatures and humidity levels) and visualize it for customers on a regular basis. Each site has four to five sensors transmitting data at intervals ranging from five to fifteen minutes, and with many users querying the aggregated sensor data. Multiplied across hundreds of sites, the volume of data was massive—and this company’s existing database was unable to scale accordingly.
This project also had to accommodate a high tempo of updates (approximately 23-24 per day). Initially, the team created a field called inserted data (containing these new readings) alongside a timestamp to indicate their latest value. However, this new update had to deal with up to 11,000 KPIs and 7.9 million hourly data points per KPI. For customers who needed data at other granularities (such as weekly or daily totals), this quantity increases even more.
As a result, the company needed a faster way to read, update, and deduplicate large volumes of data. They also needed a better concurrency rate—while they were ingesting 1,000 to 1,100 transactions per second (TPS), they needed to scale to 2,500 TPS. This was also the case for queries per second (QPS): when the platform was not batching requests, it had to handle up to 55,000 queries over the course of an hour.
Today, this company utilizes Imply Manager to deploy their Druid clusters on Microsoft Azure, and Clarity to monitor performance across multiple business units. In addition, the Imply team helped deploy an extension to statistically sample huge volume, high cardinality datasets without compromising accuracy, improving performance and reducing operational overhead.
Druid’s aggregation and querying empowers a critical use case: generating alerts and assisting the scheduling of predictive maintenance. Thanks to the granularity of the data aggregated by Druid and made available for querying, users can create different levels of alerts for various thresholds. As an example, if an assembly line exceeds a specific, lower temperature limit, a manager can be alerted and can then assess the issue. At a higher temperature, the system may automatically stop production or execute other actions, like fire suppression.
Use case: analytics for public transit
As cities’ populations grow, shrink, and move from one district to another, mass transit becomes more data-driven. Analyzing and aggregating transit data provides insights into the usage, revenue, and performance of buses, trains, light rail, ferries, and subways, enabling transit authorities to adjust schedules in response to demand, assess the effectiveness of routes, and optimize staffing and fares.
Alongside performance monitoring, IoT devices can also be used for other functions, such as predictive maintenance, signaling and train control, and passenger communications (such as status updates). Used properly, IoT analytics can help ensure a smoother, safer, and more streamlined experience for all mass transit stakeholders—from bus drivers to maintenance workers to passengers.
An example of how IoT devices could fit into bus routes.

Still, challenges persist. Data has to be constantly available in order for different functions, such as communication-based train control (CBTC) and arrival notifications, to operate; any outages can drive transit to a halt or leave passengers in the dark, negatively impacting safety, rider trust, and agency reputations.
When crises escalate, teams of engineers, analysts, public relations reps, and others will have to query data in an open-ended, flexible manner to find out the root cause of an issue (such as a signal outage or a track fire) and respond accordingly. Speed is essential even at scale: some mass transit systems have tens of buses or subways plying hundreds of stops, each vehicle likely generating multiple events per second.
Why Druid for analyzing public transit?
Scalable. Depending on the time and date, transit systems can generate a large volume of events—or little to none. Druid can scale elastically as needed to accommodate either rush hour peaks or sleepy holidays.
Available. Any interruptions in data can have cascading effects on the public, leading to consequences as citizens lose the ability to move around their communities. Any database that underpins mass transit systems must be always available, as city life never stops.
Performant under load. Whether it’s applications querying the database for bus arrival times or commuters checking the status of their subways, databases must support high volumes of queries and users. Druid can return query results in milliseconds—even as the rate of queries per second stretches into the thousands.
Customer example: an analytics provider for mass transit
This company provides a smart analytics platform for public transit networks across more than 100 cities, including Miami, Oakland, and Philadelphia. Using these insights, transit planners can then determine the percentage of early, on-time, and late arrivals and departures, comparing current performance with historical trends.
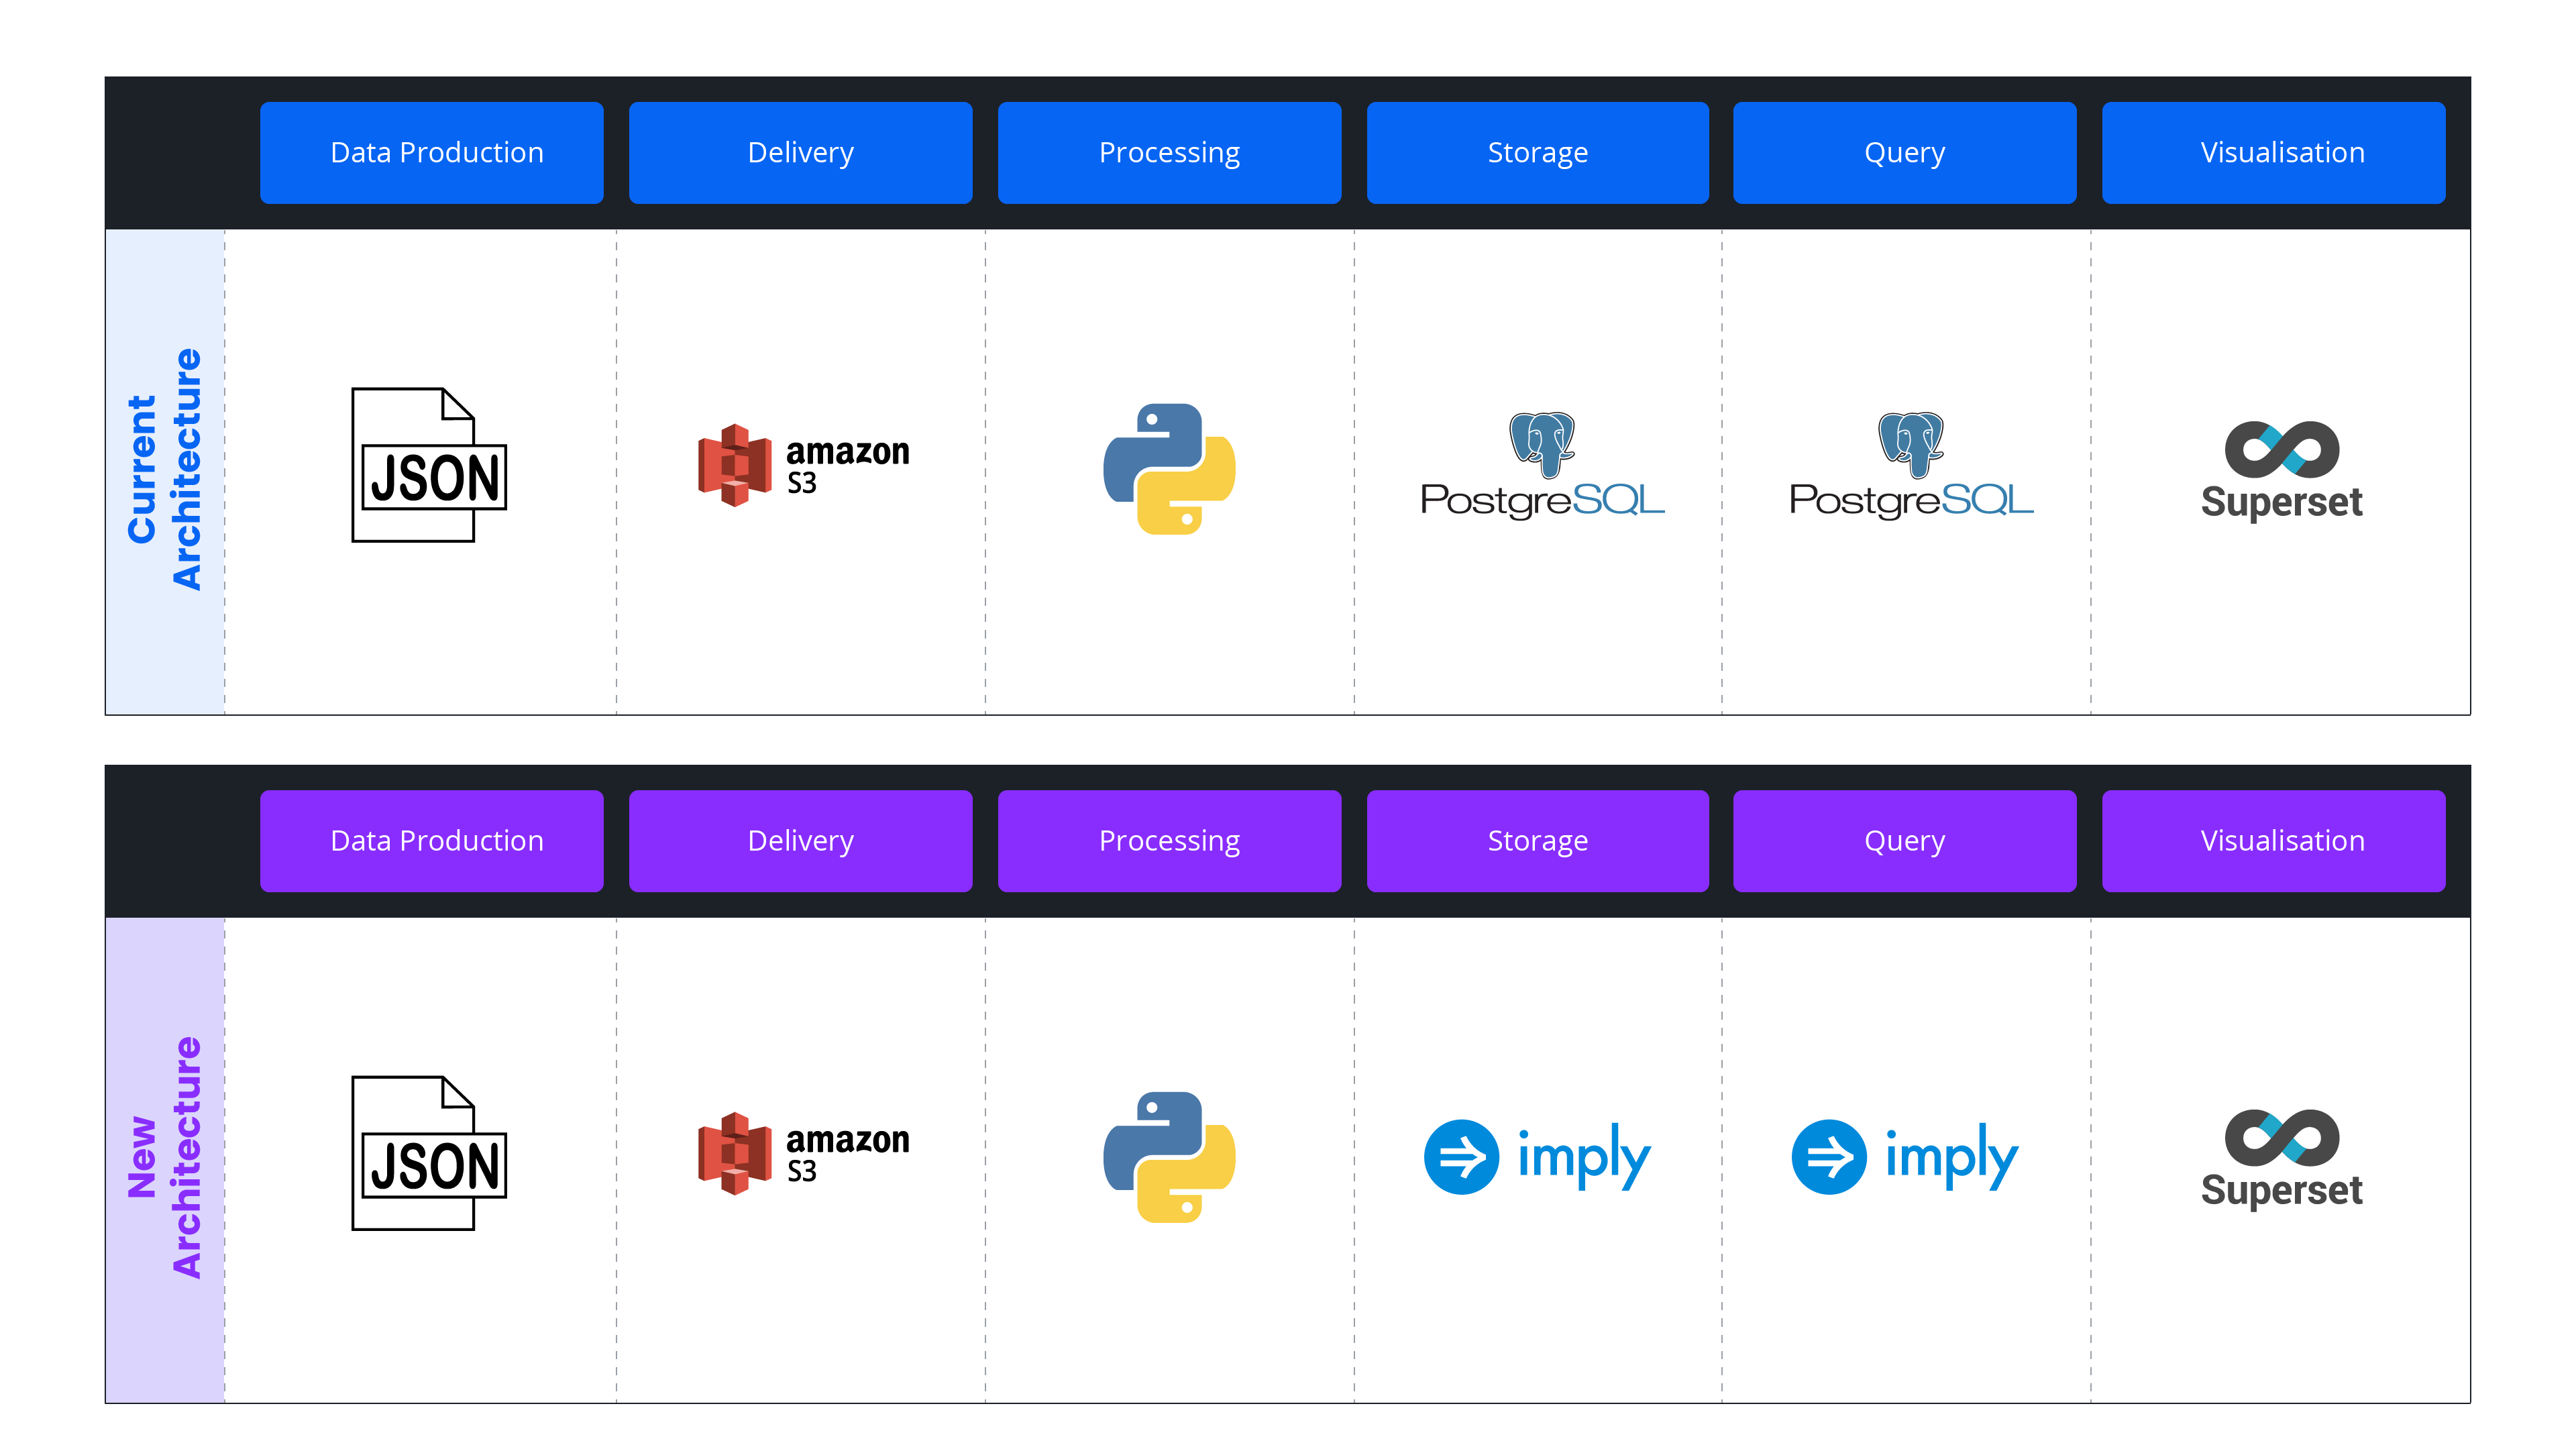
Their customer agencies generate data from approximately 25,000 vehicles (and millions of passengers), which were produced in a JSON format. From there, the JSON data was loaded by batch into Amazon S3 buckets, which were then run through a Python process to expose GPS data. Then, the data was ingested into PostgreSQL for storage and querying, and visualized through Superset.
Before and after architecture diagrams.
Unfortunately, PostgreSQL was both expensive to run (with an annual price of over $200,000) and ineffective. Despite its high cost, PostgreSQL could not scale easily, return query results quickly, or provide constant availability. PostgreSQL was also capped at 120 TB of data, beyond which it was unable to support Switfly’s needs.
PostgreSQL’s limit also made it unable to support feature walkthroughs for the sales team. Because prospective customers signed multiyear contracts for this company’s services, showcasing their platform is a critical part of the sales cycle. PostgreSQL’s inability to accommodate additional customers and product demonstrations for potential buyers inhibited the sales process, reducing revenue and slowing company growth.
Further, PostgreSQL was unstable and prone to outages, which in turn created downtime for their applications. With no tools to monitor PostgreSQL, the team could not resolve issues before they escalated, and they often only found out about problems from unhappy customers.
To support growth and reduce costs, the company switched to Imply. By integrating Imply’s distribution of Druid into their database architecture, the team used a single Druid cluster to scale up to serve 500 customers. This enabled the team to reduce expenses to approximately $30,000—a nearly sixfold decrease from PostgreSQL.
The team also selected Imply Clarity to monitor their Druid environment. Although Druid is highly reliable by design (as data is persisted into a deep storage layer for continuous backup and to facilitate scaling), having visibility into the the health and performance of this company’s Druid clusters is a stark contrast to their previous experience with PostgreSQL.
The transition to Druid has also enabled use cases for their own internal departments. Not only can engineers more easily roll out proofs of concept (POCs) for sales demonstrations, but other company stakeholders can also unlock more insights to better understand and address customer needs.
By choosing Druid, this company has also future proofed their stack. Going forward, they plan to switch from batch data in S3 buckets to streaming, real-time data delivered by Amazon Kinesis. Druid is highly compatible with Kinesis: Druid’s native Kinesis indexing service can read events rendered in Kinesis’ own format (shard and sequence numbers), providing exactly-once ingestion to ensure data consistency and reliability. In fact, leading customers like Lyft, Ibotta, and Twitch utilize both Kinesis and Druid to power analytics.
Use case: utility management
IoT is also critical for electric grid operations. Utilities need to forecast energy consumption to control grid operations, schedule loads, and even buy additional power to meet sometimes unpredictable demands.
Because demand ebbs and flows throughout any given day, ensuring a constant energy supply is critical. Currently, bulk energy storage is difficult or expensive, though solutions like pumped storage hydropower or gravity batteries show significant promise. Until these technologies reach maturity and offer a more consistent and reliable source of power, utilities have to balance supply and demand across a portfolio of different sources, plants, and transformers.
Given that rightsizing resources to accommodate demand is so important, utilities often have large teams of analysts querying consumption data, bidding on electricity from outside providers, training predictive algorithms, and more. Queries are time sensitive, and because energy markets are only open at certain hours of the day, are often executed concurrently.
Going forward, utilities will also have to contend with a more decentralized energy landscape, as consumers create their own microgrids through solar panels or wind turbines. While microgrids diversify energy sources and help reduce the severity or frequency of outages, they also create complexity, adding an extra source of IoT data or billing considerations like net metering.
Why Druid for utility management analytics?
Scalability. Druid can scale to keep pace with any fluctuations in electricity usage due to circumstances such as time of day, outside weather conditions, or even date (holidays or days of the week). Thanks to features like rollups, pre-aggregations, and compression, Druid ensures that even if new meters or microgrids are added, expenses won’t skyrocket.
Consistency. Druid provides exactly-once ingestion, so that events are not duplicated regardless of the number of data sources or the complexity of a utility’s energy environment. No matter where data comes from—whether it’s transformers, smart meters, or wind turbines—data will be consistent and organized.
High concurrency. Factors such as query rates or user numbers do not affect Druid’s query efficiency. Even if hundreds of analysts are racing the clock to secure vital electricity for the peak evening rush, Druid will still return query results within milliseconds.
High interactivity. To get the results they need in the time they have, analysts must explore data visualizations rapidly and flexibly, filtering by dimensions like zip code, slicing and dicing by week, or zooming into map areas. Druid enables users to drill down and uncover the insights they need, rather than relying on rigid, preset dashboards.
Customer example: a leading utility management company
This company provides an AI-enabled SaaS platform that empowers power plants, retailers, utilities, and grid operators to better understand and serve over 45 million global customers.
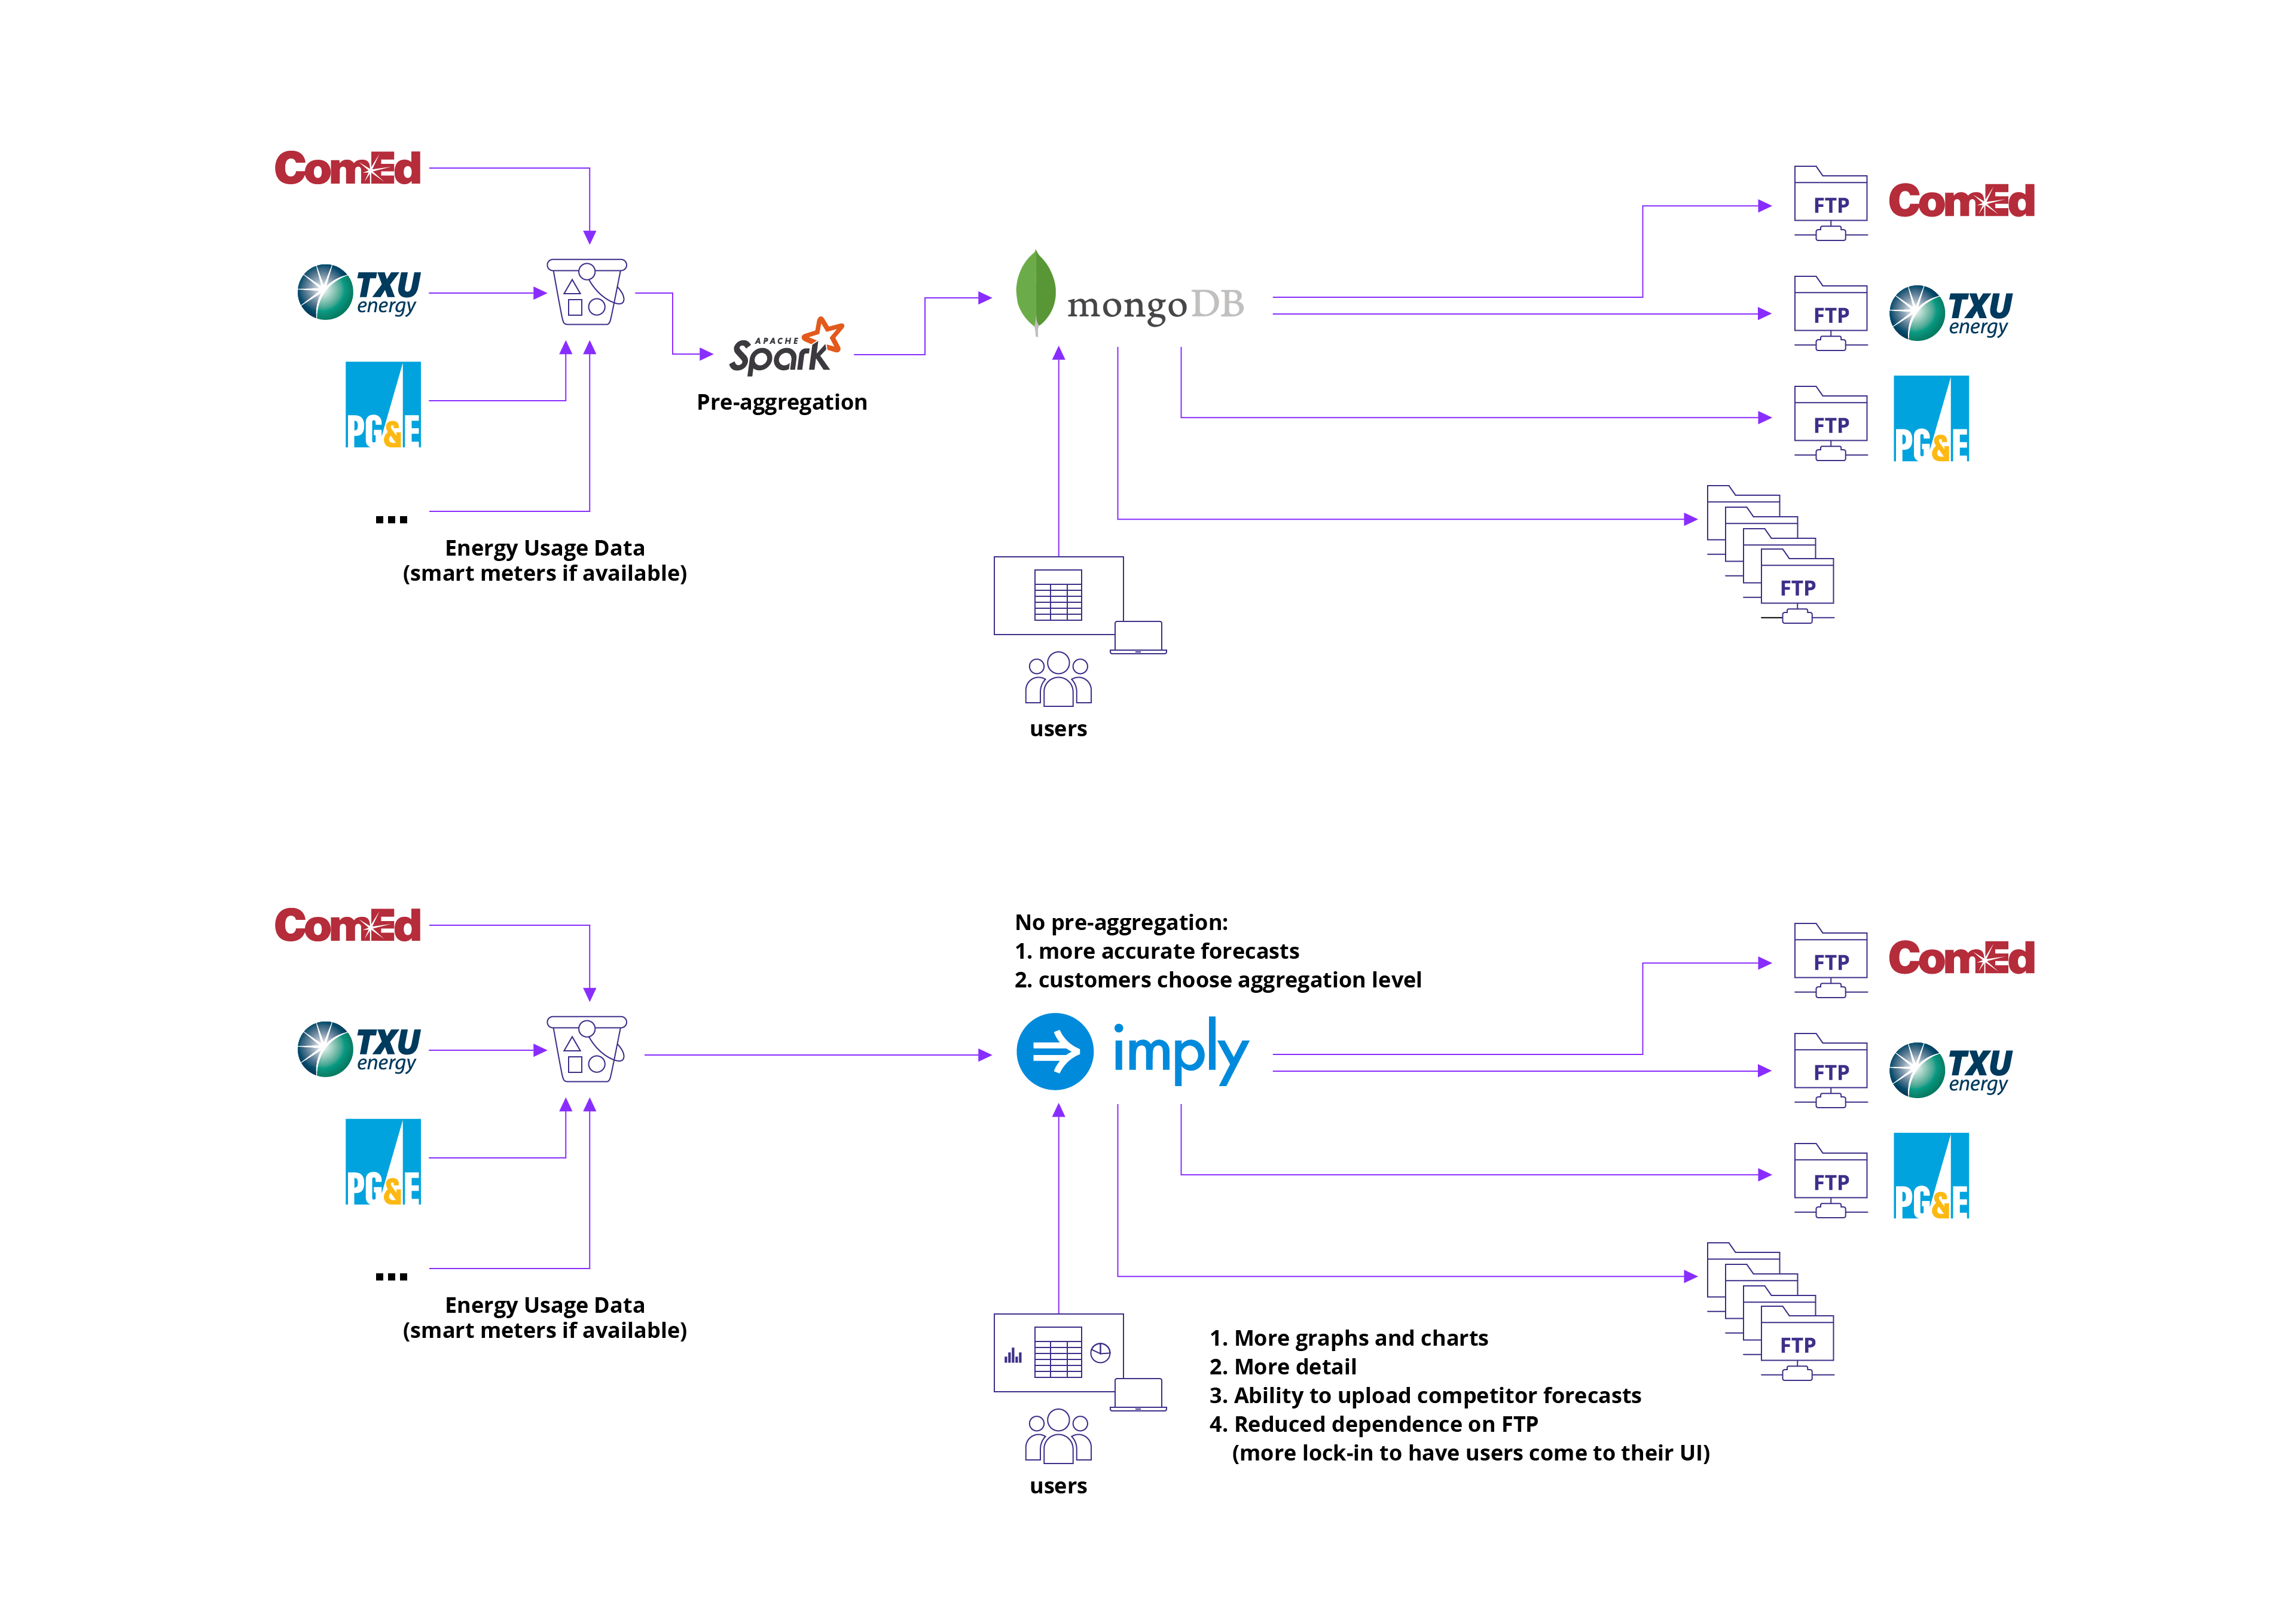
Previously, they used a variety of tools for their data architecture. First, utility customers (such as Consolidated Edison or Pacific Gas and Electric) would submit data to this company directly or through a third-party. Then, data would be loaded into an Amazon S3 bucket, where the company’s engineers would create Amazon Athena tables on top of the data. Finally, the data would be pre-aggregated in Apache Spark, loaded into MongoDB for analysis, and then visualized for utility customers in this company’s custom UI.
However, this organization grew rapidly, almost doubling its data intake—from 40 million to 70 million smart meters—within a very short period of time, and their data infrastructure could not scale to keep up. More meters and more data also meant more concurrent activity, as more analysts simultaneously queried this data during market hours.
Any latency would make the data unusable. As one engineer explained, “We go off this notion that if the client has it and it’s not fast, then it might as well be broken, because they need to be able to create insights really quickly off of that data.”
Ironically, due to the limits of their database, they could not provide detailed, meter-level data to their utility customers—despite building its product on the analysis of this granular data. They also could not offer open-ended data exploration, although customers often requested custom aggregations (such as grouping usage by geographical region or zip code).
By switching to Imply, this company enacted several key changes. First, they removed Apache Spark from their data architecture, instead ingesting smart meter data directly into Druid. By transitioning from batch to real-time data, this company could predict energy demand more precisely, helping customers make more informed decisions on purchasing power. As a bonus, Druid is natively compatible with Apache Kafka, and given their plans to incorporate streaming data later on, this organization has effectively future proofed their stack.
Before and after architecture diagrams.
Their engineers were also able to automate or remove tedious tasks, freeing them up to focus on their core product. Whereas a SQL-based solution would require constant schema changes every time a new utility customer was onboarded (or updated their own schema), one company engineer explains that “Druid would automatically detect new columns, removing the bottleneck of having to configure a new model for that client.”
Previously, this process would require the sales team to engage with clients to understand their needs, before consulting with the engineering team to determine how proposed changes would impact schema. Now, the engineering team no longer needs to get involved, and can instead concentrate on other work.
Lastly, end users—from utility customers to internal teams—can now experience faster dashboards, more interactive visualizations, and ad hoc aggregations. Utility analysts now use a Pivot-based interface to easily understand forecasts, compare current and predicted usage against historical trends, and pinpoint customer needs with greater accuracy.
In addition, aggregations also come with a greater degree of customization. As an example, company engineers created a time block filter that broke down event data by specific blocks of days, excluding weekends and any hours that were missing data, tokenizing the data and restricting access to a handful of specific roles.
Ultimately, this company was able to reduce operational costs by $4 million, improve the accuracy of its forecasts by 40 percent, and enhance the lifetime value of customers by $3,000.
About Druid and Imply
As the database for speed, scale, and streaming data, Apache Druid was created to handle data in massive quantities, processing anywhere from hundreds of thousands to millions of events per second—equating to billions of events per hour.
Druid is also easily scaled up or down, without the use of any expensive or time-consuming workarounds. Different functions, such as query, storage, and cluster coordination, are split into separate node types that can be independently scaled as needed. Afterwards, the remaining data is automatically rebalanced, or if necessary, pulled from Druid’s deep storage layer and redistributed among the various nodes.
Deep storage also maintains resilience and reliability by serving as a continuous backup and emergency data store. Should a node fail, its data can be accessed from deep storage and allocated onto any remaining (or restored) nodes.
Druid is natively compatible with two of the most common streaming platforms, Amazon Kinesis and Apache Kafka, enabling it to ingest data without any additional workarounds or connectors. Data is ingested exactly once, ensuring that no events are duplicated, and are instantly made available for querying and analysis.
Druid can autodetect schema, change tables accordingly, and avoid any downtime in the process. In contrast, other databases require tables to be manually altered whenever schema is changed, an operation that can take the entire database offline for hours as updates run. And because IoT data schema can change Druid’s schema autodiscovery can also
This is especially important for IoT networks, as device firmware is often upgraded in a piecemeal fashion. This usually results in data with different fields—data collected by devices with up-to-date software may have different fields that older data is missing, and vice versa. However, Druid’s schema autodetection features will ensure that fields remain consistent across all data (older tables will simply have a NULL value where they’re missing this information).
Along with open source Apache Druid, Imply also features paid products including Polaris, the Druid database-as-a-service—and the easiest way to get started with Druid. Another popular product is Pivot, an intuitive GUI that simplifies the creation of rich, interactive visualizations and dashboards—for both external and internal use.
To learn more about Druid, read our architecture guide. For more information on how Druid can help your team simplify your IoT environment, check out our dedicated use case page.
For the easiest way to get started with real-time analytics, start a free trial of Polaris, the fully managed, Druid database-as-a-service by Imply.