Make your real-time dashboards blazing fast with per-segment caching
May 11, 2021
Suneet Saldanha
Apache Druid is a real-time analytics database that is designed for fast slice-and-dice analytics on large datasets. Because of this capability, Druid power users may choose to set up real-time dashboards so that other users can take advantage of Druid’s speed and slice and dice the data to get insights.
In this post, I’m going to talk about how per-segment result caching works, and why it’s the best option if you are serving real-time dashboards. I’ve worked in Application Performance Monitoring for the last few years, so I’m going to draw from my experience in this example.
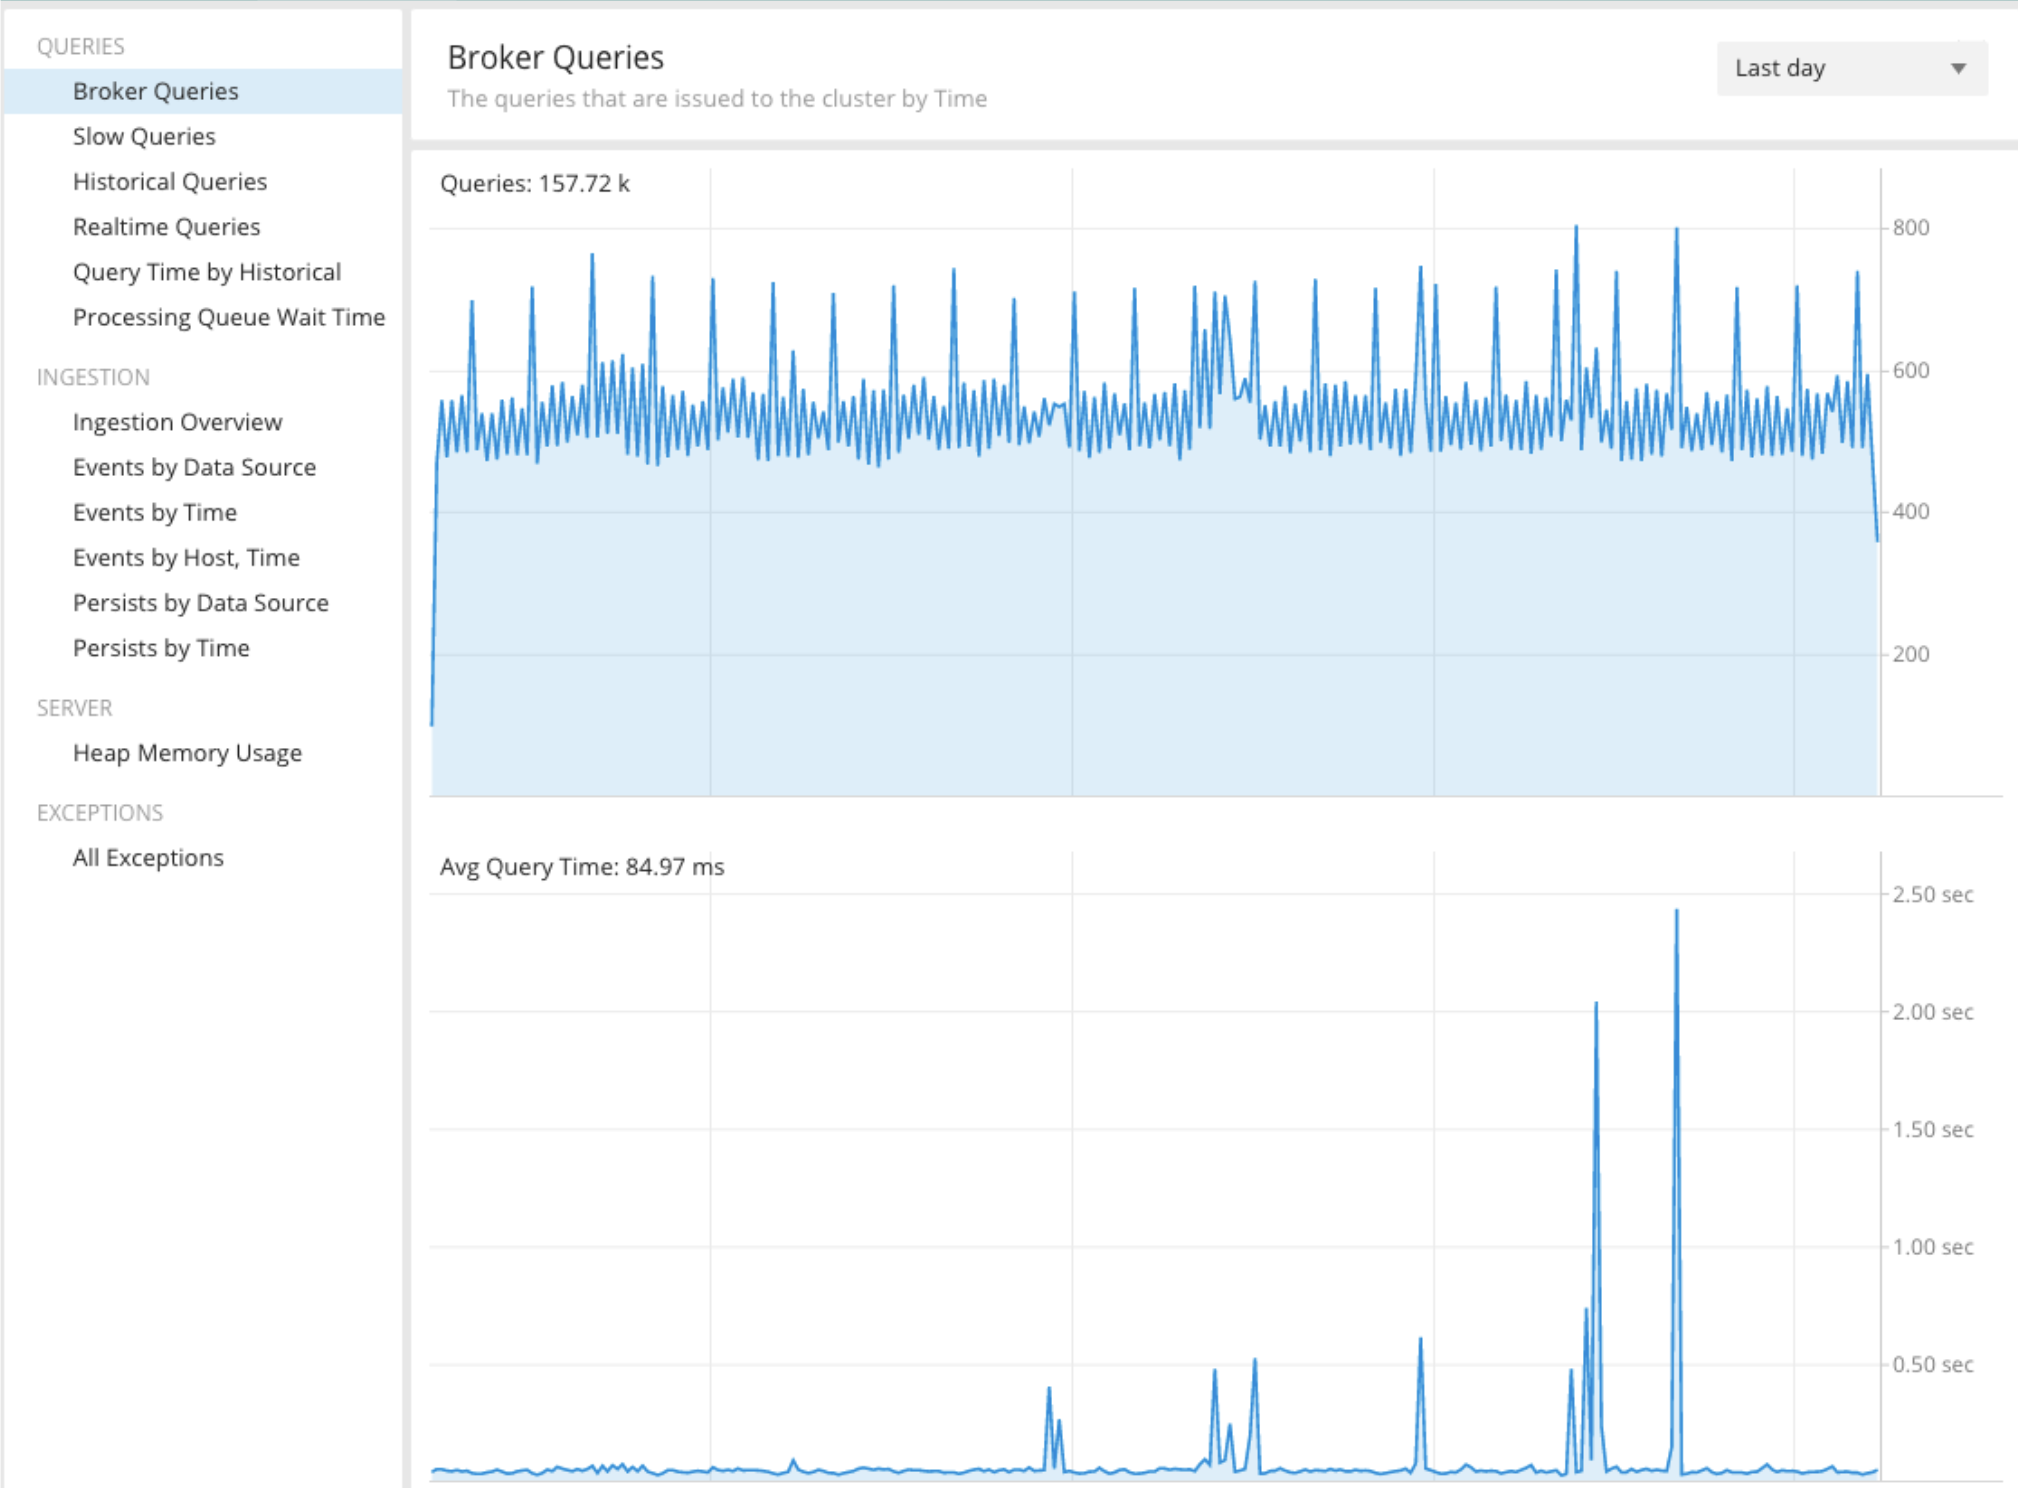
Imagine a scenario where Druid is collecting metrics about a huge microservices application —there’s a continuous stream of metrics coming in about the different services from this application. To help the DevOps team know if the services are healthy, we’ve decided to build a real-time dashboard that the entire team can use as the starting point for investigating any issues with the application they are responsible for managing. Since the team is primarily focused on triaging issues in real time, the dashboard is showing metrics for the last day. For you eagle-eyed readers, yes, this is an Imply Clarity dashboard that is monitoring a production Druid cluster; there’s nothing quite like Druid being monitored by Druid! 😉
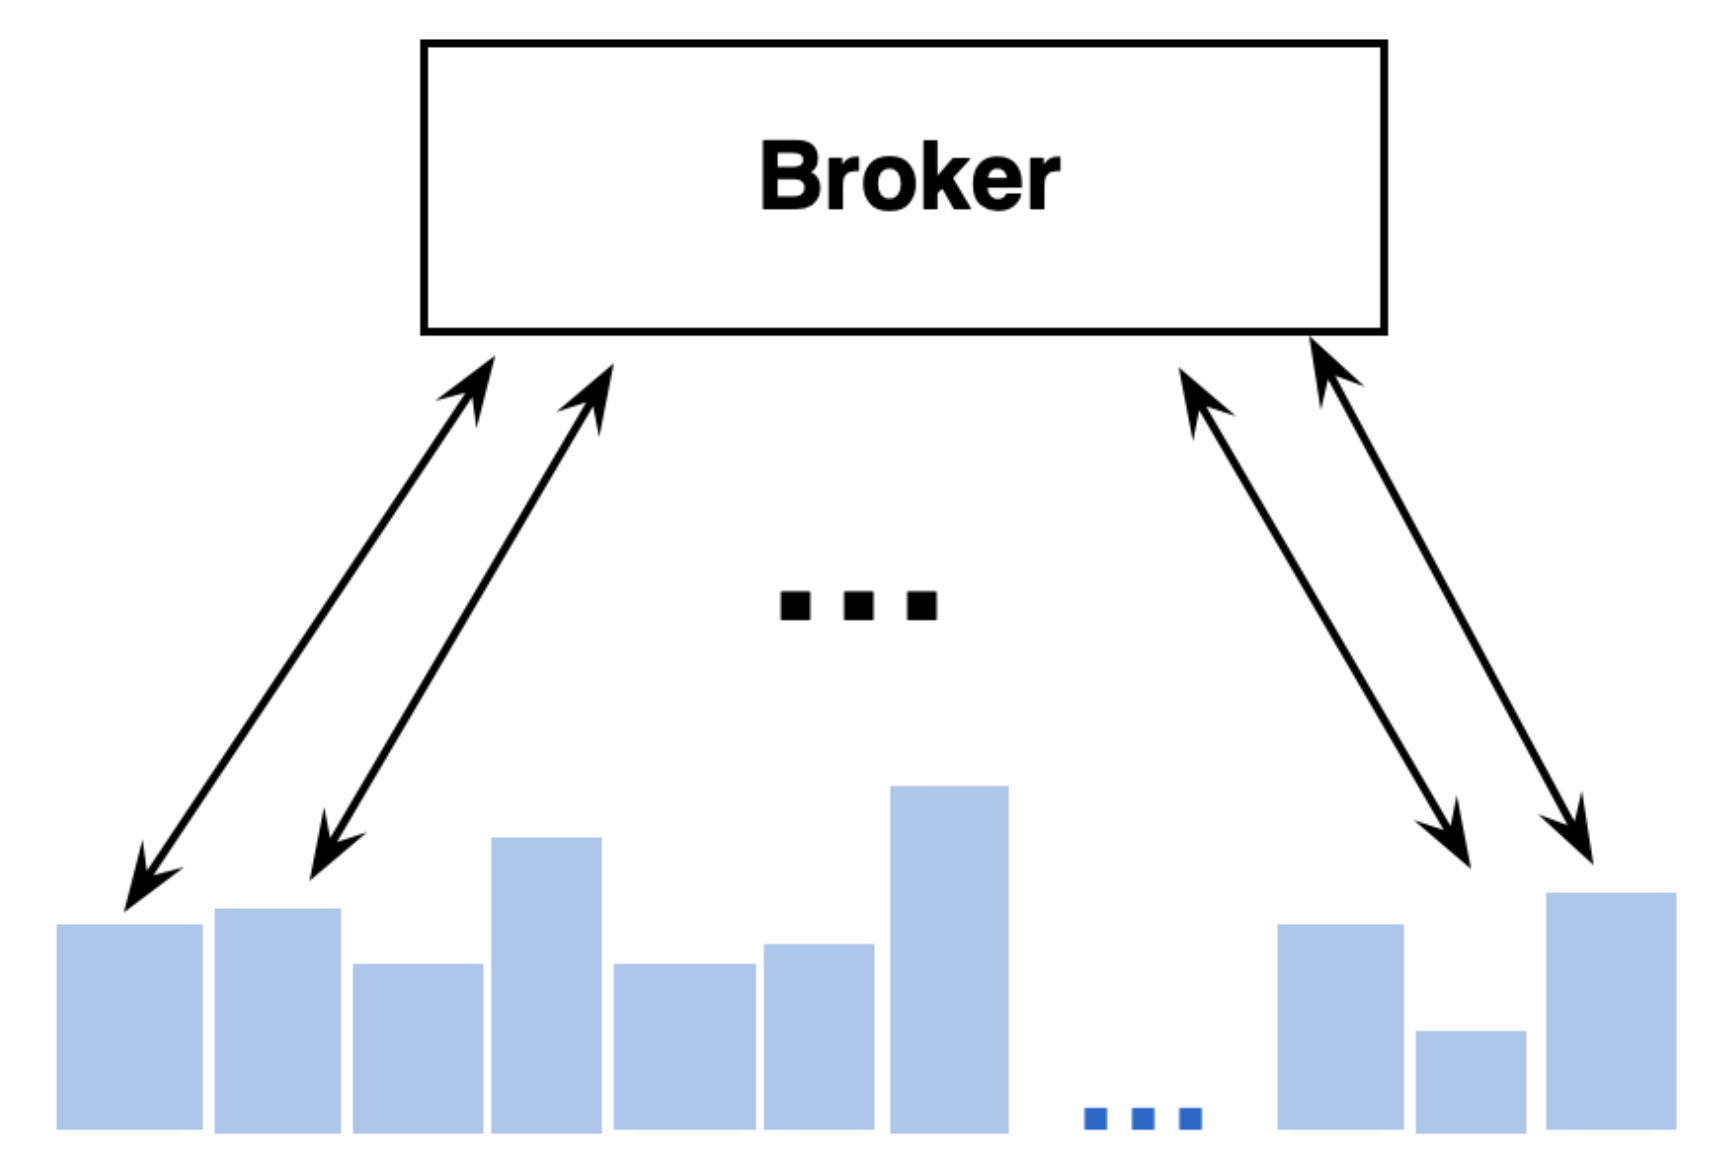
Behind the scenes, when a user loads the dashboard, queries are issued to the broker. This is then fanned out to the data nodes for all segments that are involved in the query. So let’s assume that this query fans out to 24 segments for the 24 hours in the last day. Druid processes these requests in parallel, and merges the result to send the final response back to the dashboard.
Now, let’s make this situation more complicated. There’s been a spike in the application’s error rate and multiple engineers are now looking at the dashboard trying to debug the problem. So instead of answering queries for one user, Druid is now trying to answer the same query for ten. This is where caching comes in handy. Since Druid has already done all the work to answer the query once, a cache saves us from doing the work to answer the exact same query again. This is where whole-query result caching can be helpful.
However, Druid is continuously streaming and processing new data as soon as it is available, so if the same query is issued again, the cached result for the whole query will no longer be valid.
Another scenario that is common for real-time dashboards is relative-time dashboards—“last 24 hours”. Let’s assume two users log into the dashboard at different times of the day and load the dashboard. It might look something like this:
[Q1] User 1 issues a query for the avg query time for the last 24hours at Tuesday 2:00 PM [Q2] User 2 issues a query for the avg query time for the last 24hours at Tuesday 3:00 PM
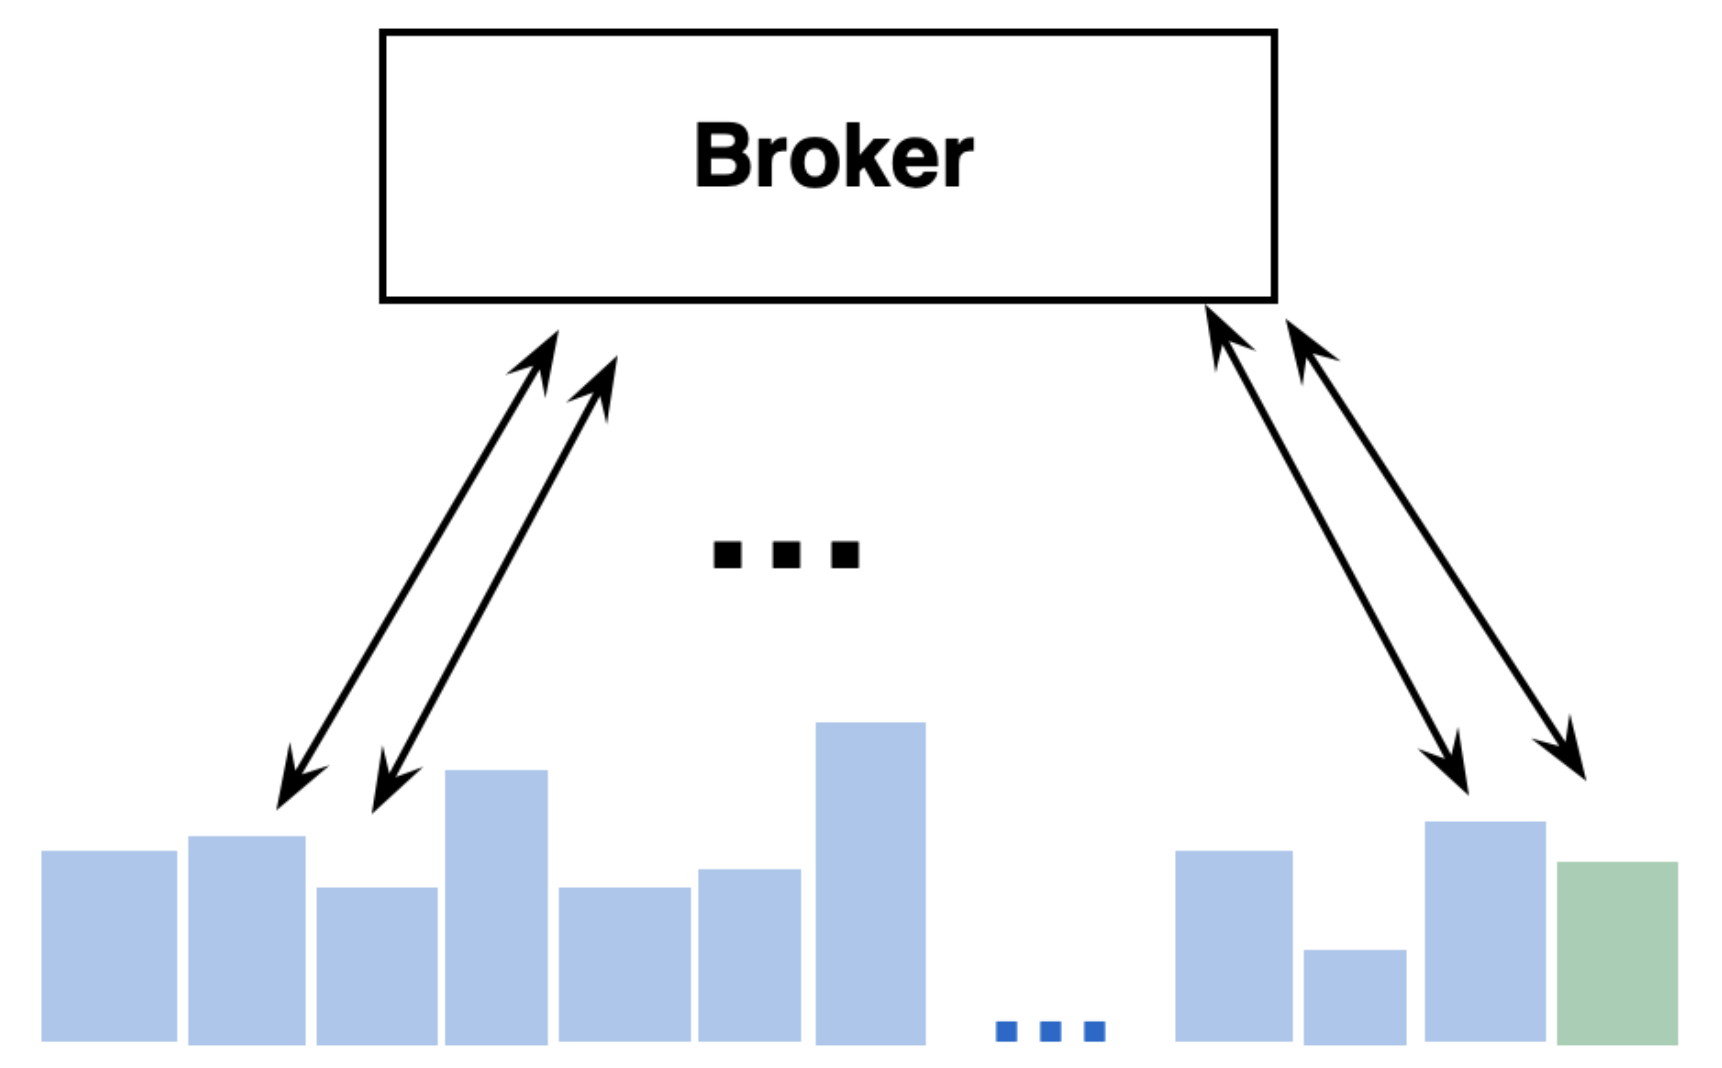
In this example, 23 of the 24 hours are common between the 2 requests. The only hour that isn’t needed from Q1 is Monday 2 – 3 pm (the first blue segment in the diagram below). Instead, we need to process new data from Tuesday 2pm -3pm (the green segment in the diagram below). This is the key insight behind per-segment result caching.
So, when the query is issued to the broker, it is fanned out to the data nodes for the segments involved in the query. For 23 of the 24 segments, the data nodes have no work to do since the results are already cached. For the second query, the data nodes only need to process data for one segment of new data. This increases the capacity of the cluster and allows the Druid cluster to serve more queries than if it only supported full-result caches.
Another key workflow that this design unlocks is enabling users to do a drill-down workflow. In this scenario, let’s say by looking at the dashboard for the last 24 hours, we notice an anomaly around 8 am – 12 pm. So we reduce the time frame to focus our investigation on the 8 am – 12 pm time horizon. Since Druid has already processed the data for this time window and cached it, drilling down from the last 24 hours to this specific time range is instantaneous.
To summarize, if you’re building real-time analytics dashboards, partial result caches are the key to getting the best performance out of the dashboard by increasing the overall cache hit ratio, while only re-doing the work to merge results into a final response. To learn more, read the Apache Druid docs on caching.
BONUS TIP: Due to parallel merging of results on brokers, it is rare for merging results to be slow. If this stage is the bottleneck, collect a flamegraph on the broker and see where the bottleneck is. If you find a bottleneck, file an issue on Github——better yet, push a PR to fix it.
If you’d like to work on interesting problems like this, check out our open positions we’re always looking for talented engineers who love to get their hands dirty on challenging problems!
Other blogs you might find interesting
No records found...
Jul 23, 2024
Streamlining Time Series Analysis with Imply Polaris
We are excited to share the latest enhancements in Imply Polaris, introducing time series analysis to revolutionize your analytics capabilities across vast amounts of data in real time.
Transform your data management with upserts in Imply Polaris! Ensure data consistency and supercharge efficiency by seamlessly combining insert and update operations into one powerful action. Discover how Polaris’s...