Interactive Analytics at MoPub (Twitter): Using Druid and Imply to Query Terabytes of Data in Seconds
Jul 05, 2019
Rick Bilodeau
MoPub, a Twitter company, provides monetization solutions for mobile app publishers and developers around the globe. They operate at a massive scale. The MoPub platform addresses over 1.7 billion monthly unique devices, 1 trillion monthly ad requests, 52,000 apps, and 180 demand side partners.
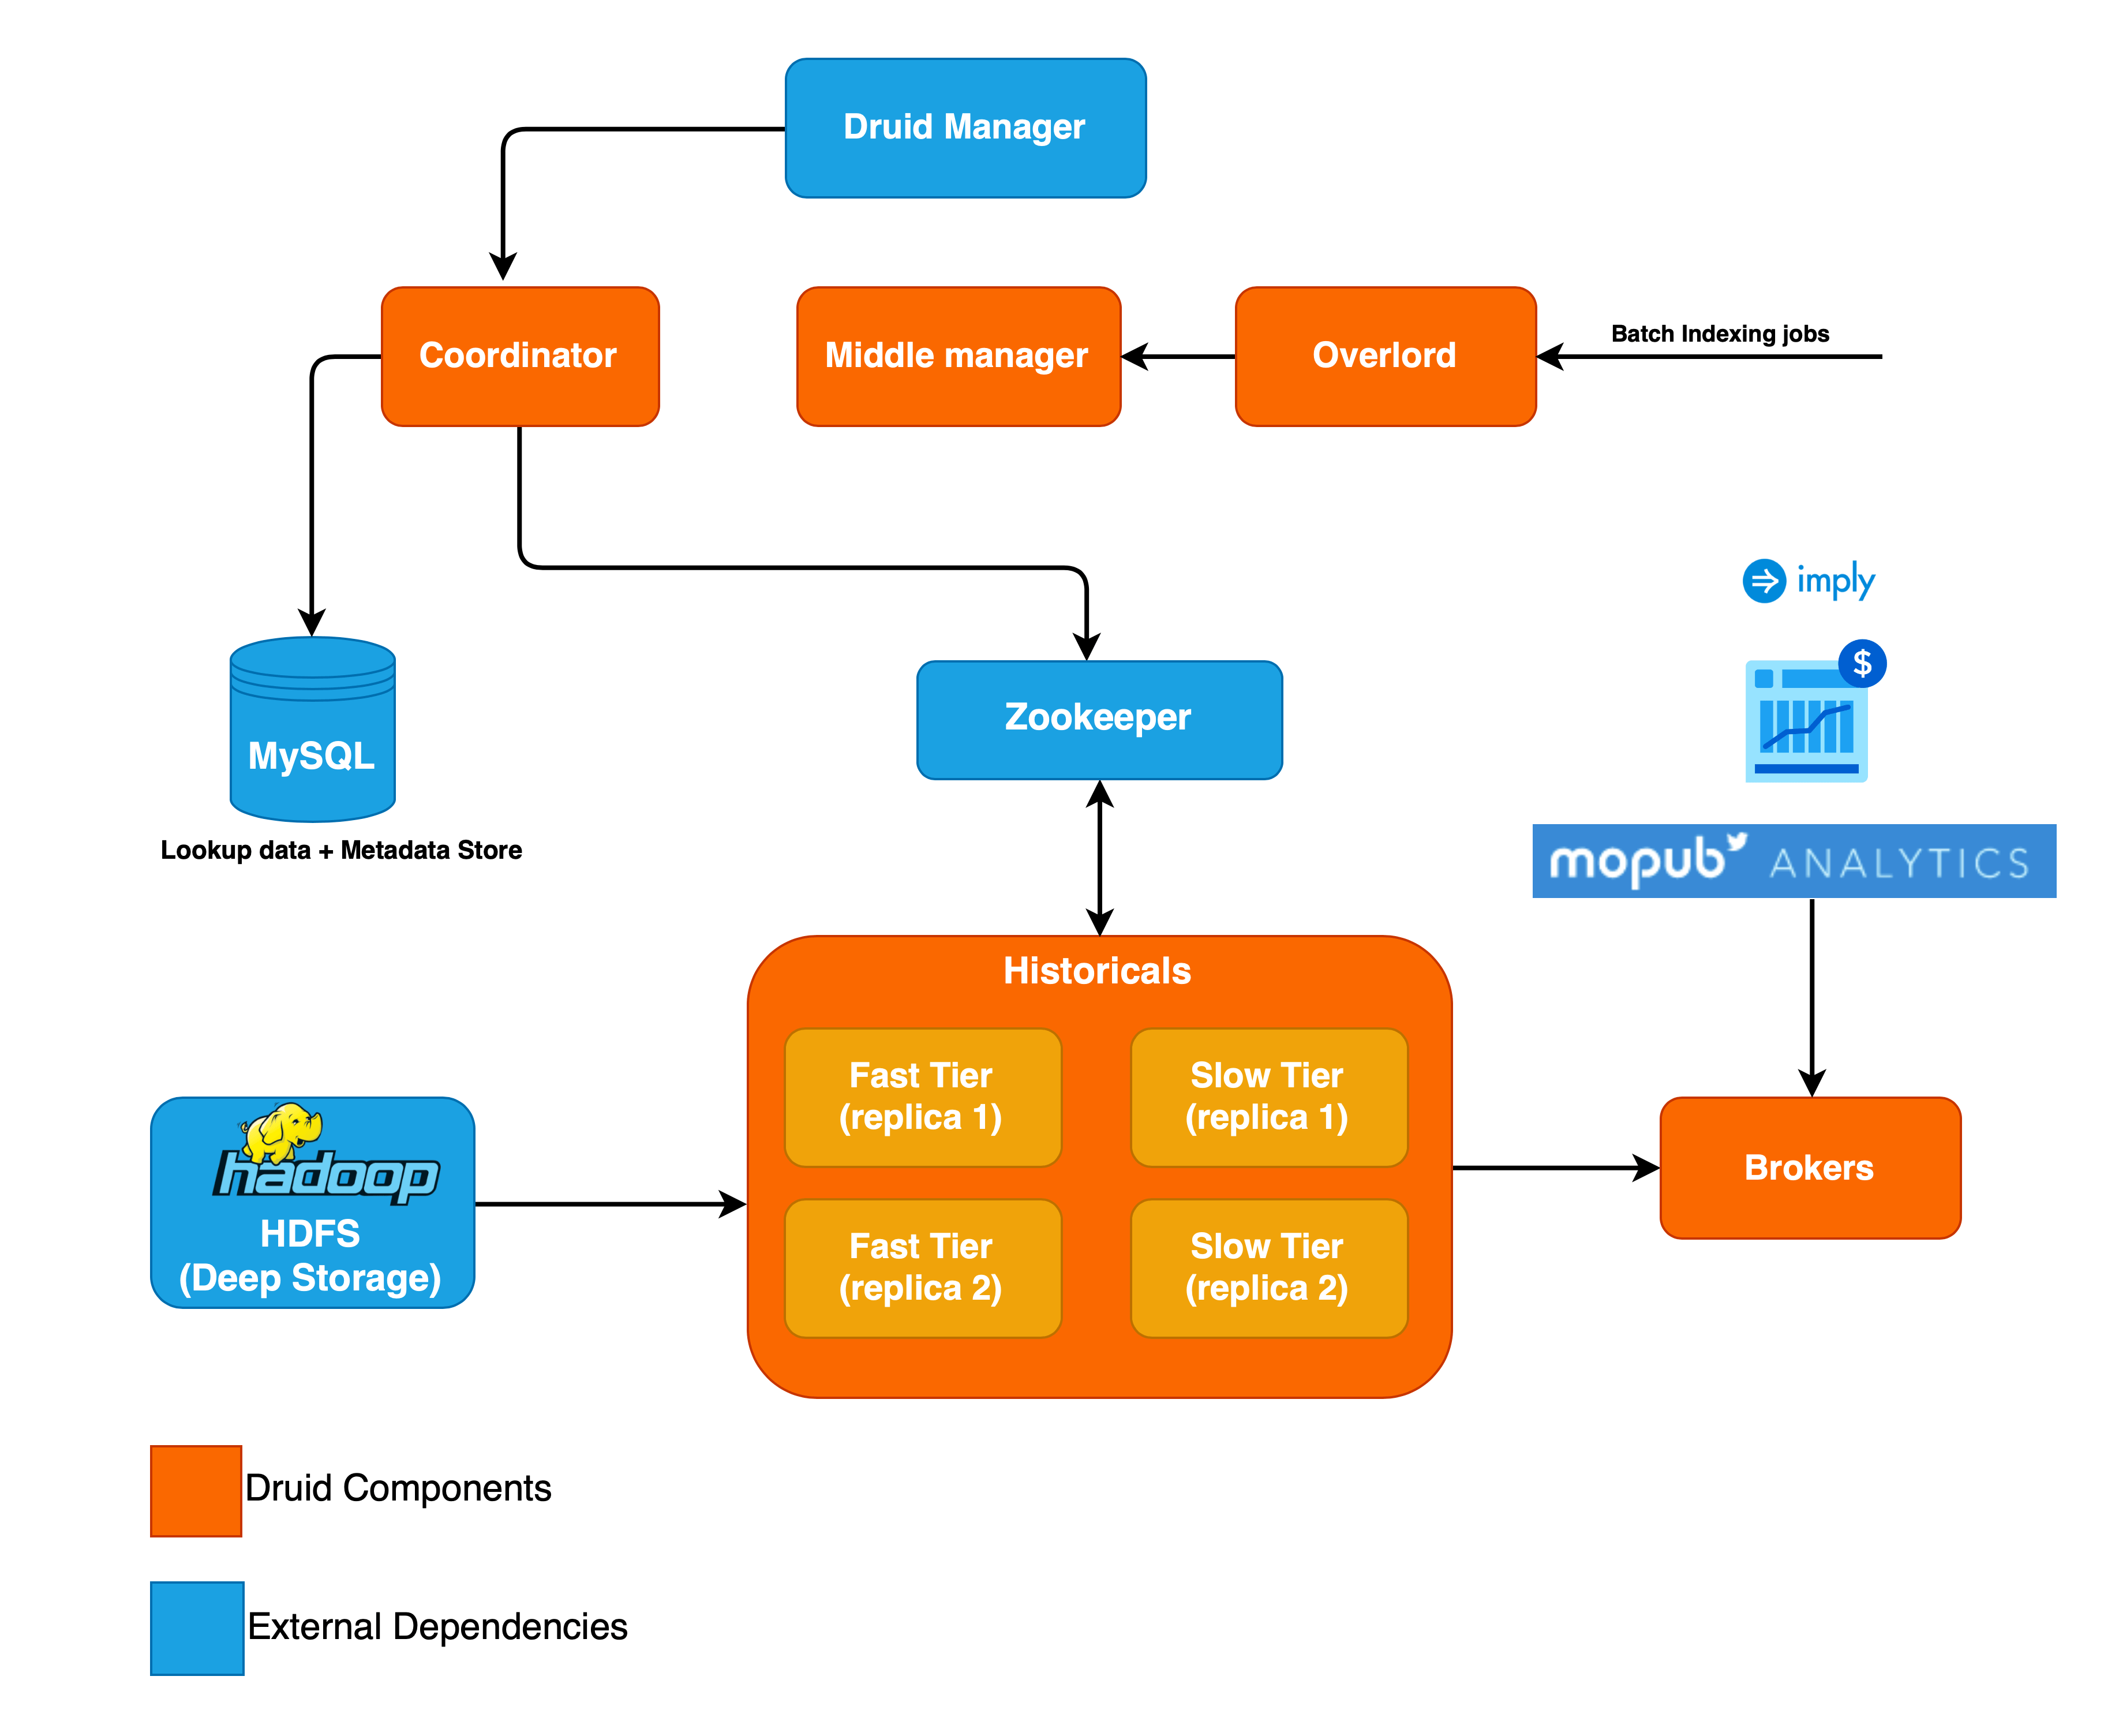
MoPub has just launched a new solution called MoPub Analytics based on the Apache Druid real-time analytics database and using Imply Pivot as the drag-and-drop UI. The solution allows MoPub customers to answer business questions, troubleshoot issues and optimize revenue. Users can determine the root cause of new data trends by interactively analyzing the data across many different time slices, dimensions, and metrics.
Every day, MoPub runs over 30 billion ad requests, which generate over 150 terabytes of raw logs. Even after aggregation they ingest over 9 billion rows into the analytics engine each day. Queries on MoPub Analytics return in seconds.
Splunk Smartstore vs Lumi Loglake: Two Very Different Ways to Search Logs in Object Storage
One copies data back before it can be searched. The other queries it where it lives. Lumi Loglake lets Splunk teams query logs directly in object storage, including AWS S3, Delta Lake, Apache Iceberg, using...
Supercharging Schema-On-Read: Logs in Object Storage Don’t Need a Data Catalog
Machine data architectures are rapidly changing. As telemetry volumes continue to grow and as costs rise, organizations are increasingly moving logs and other machine data into object stores such as AWS S3....
Imply Lumi Loglake vs Splunk Federated Search for S3
Teams are increasingly moving log data into AWS S3 to reduce costs and extend retention. Both Lumi Loglake and Splunk Federated Search to S3 help you query data in AWS S3 to lower costs, however the two technologies...