Clickstream Funnel Analysis with Apache Druid

Sep 11, 2019
Mike McLaughlin

Every effective website and application exists to offer a route for its visitors to achieve some goal: clicking on a button to sign up, following a link to gain a deeper understanding, or simply viewing an asset to raise general awareness. The routes to completing these goals are ingrained in the very essence of the application – they define its reason for existing. All manner of hypermedia and both human and automated logic is used to create an experience where people are encouraged to follow a path to carry out some course of action.

Collecting data about how users interact with your website or application gives product managers, customer experience engineers and marketers the metrics they need to analyze the efficacy of those pathways. And, with this data and analysis, they can iteratively improve the designs to make that journey simpler, more engaging, and less time-consuming.

This analysis, commonly referred to as clickstream analysis, has broad market applicability, having started with company websites in the 90s and evolved to e-commerce sites, SaaS applications, mobile apps, game interactions and consumer IoT devices.

Applications such as Google Analytics and Adobe SiteCatalyst (previously Omniture) exist to help with clickstream analysis. However, these applications have scale limitations and lack access to raw data. When site operators and application teams hit these limits, they frequently turn to Apache Druid. In this blog post, we’ll deep dive into how you can easily build your own custom and scalable clickstream analysis engine using Druid.

Introduction

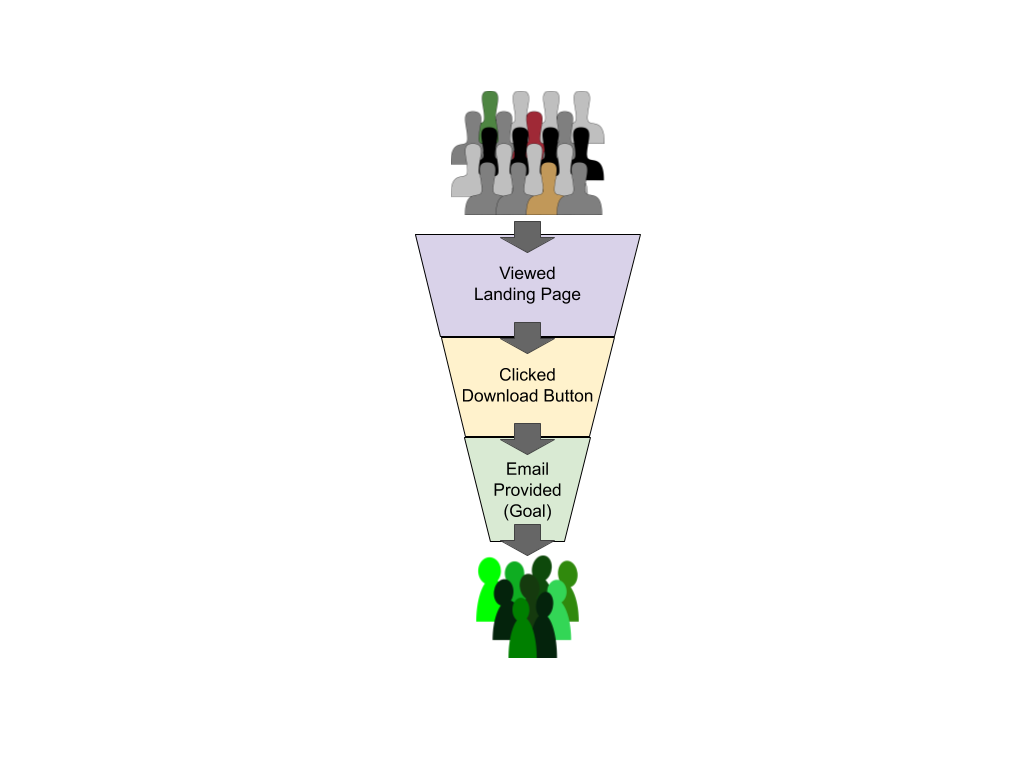
A funnel is a visual representation of the journey a user took to reach your goal. Imagine one objective of your website is to collect email addresses to drive the sales pipeline. For this objective, you create a landing page that provides valuable content in exchange for the user’s email address. This simple example involves just 3 steps that the user must take:

  • Go to the landing page,
  • Click a link/button to download, and
  • Enter an email address.

Fewer people will click “download” than go on to the landing page itself. Fewer people still will enter their email address. Visually then, this looks like a funnel – with the entry point at the very top. At the exit point are those visitors who completed the entire journey and achieved our objective for them: in this case, entering their email address to download the content from our landing page.

Analysis of the funnel is critical to learning from design decisions: how long did it take to get from the top to the bottom? What kinds of people abandoned their journey half-way through? When we made a change to page X, did it improve conversion rates from one step to the next?

It’s easy to see why funnel analysis has become such an important technique in designing user journeys.

Preparing for Funnel Analysis

You’ll need three things to build your funnel:

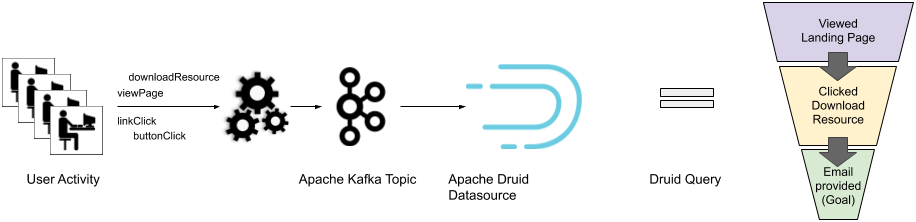
  1. A stream of data that describes actions being taken by users: the “events”,
  2. A way of determining which events evidence activity at a stage of your funnel: the “map”, and
  3. A way to explore the collected data by generating useful metrics quickly.

User Activity Events

Every activity or action performed by a user that relates to your objectives for them needs to be recorded so it can be easily analyzed.

The types of activities that get recorded will vary from application to application but are likely to include events such as “page viewed”, “link clicked”, and “form completed”.

And while the actual content of those recorded events will also vary, they are more than likely going to include at least:

  • What was attempted?
  • When was this attempt made?
  • Who tried to do it?
  • Did they succeed?

Here’s an example of an event record in JSON format recording that a user with ID 45 viewed the home page on Monday 29th April 2019 at 15:13 UTC:

{
    “type”: “pageView”,
    “timestamp”: 1556550797,
    “userId”: 45,
    “details”: {
        “pageId”: “home”
    }
}

Mapping Events onto Funnel Stages

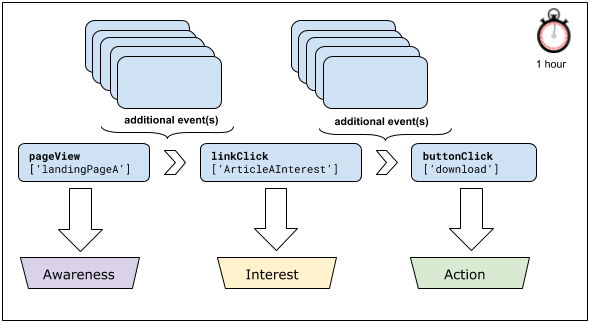
Once you have determined which events are being recorded, you can map these onto the stages of your funnel. Remember that your application may be capturing more events than are actually needed for your analysis. Identify those events that indicate a significant change in behavior and ignore the rest. In the diagram below, you can see that we have identified three very clear stages: all the rest we’re just noting as “additional event(s)” and can be ignored.

Computing Metrics

Now that we know the events, and we have mapped these to the funnel, what kinds of answers might we want?

  • How many users viewed the page but did not click the link?
  • Of the users that did not click the link, how many went on to do something else on this site?
  • How much time, on average, did the visitors spend on the page before they clicked on the article link?

For most funnel analysis, approximate answers to these questions are perfectly acceptable: we want an indication of typical behavior, not to submit an audit report to the tax office. We need real-time statistics that help us improve the design, the feel, the experience of our application: we simply don’t need exact figures for this creative exercise.

You may ask “why not get an exact answer”. In short, at scale you may not be willing to wait minutes for an exact answer, whereas an approximate answer using innovative techniques I describe below may take a second or less instead. This time difference is especially true if the query is part of an ad hoc and iterative data exploration where the answer to the last question informs the next one in real-time.

A key advantage of using Apache Druid, an open source data base built for real-time ad hoc analytics, is its support for a super fast, super efficient open source library to generate approximate statistics. This library, known as the DataSketches library, dramatically speeds up calculations for this kind of analysis. In fact, it’s used every day for real-time, on-the-fly statistical analysis on extremely large, extremely busy websites.

Apache Druid provides access to these algorithms through an extension called the Theta Sketch module. For operations like those needed for funnel analysis, this module is exactly what we need. It will help us answer the questions posed in the previous section very quickly and efficiently.

Sample Funnel Analysis

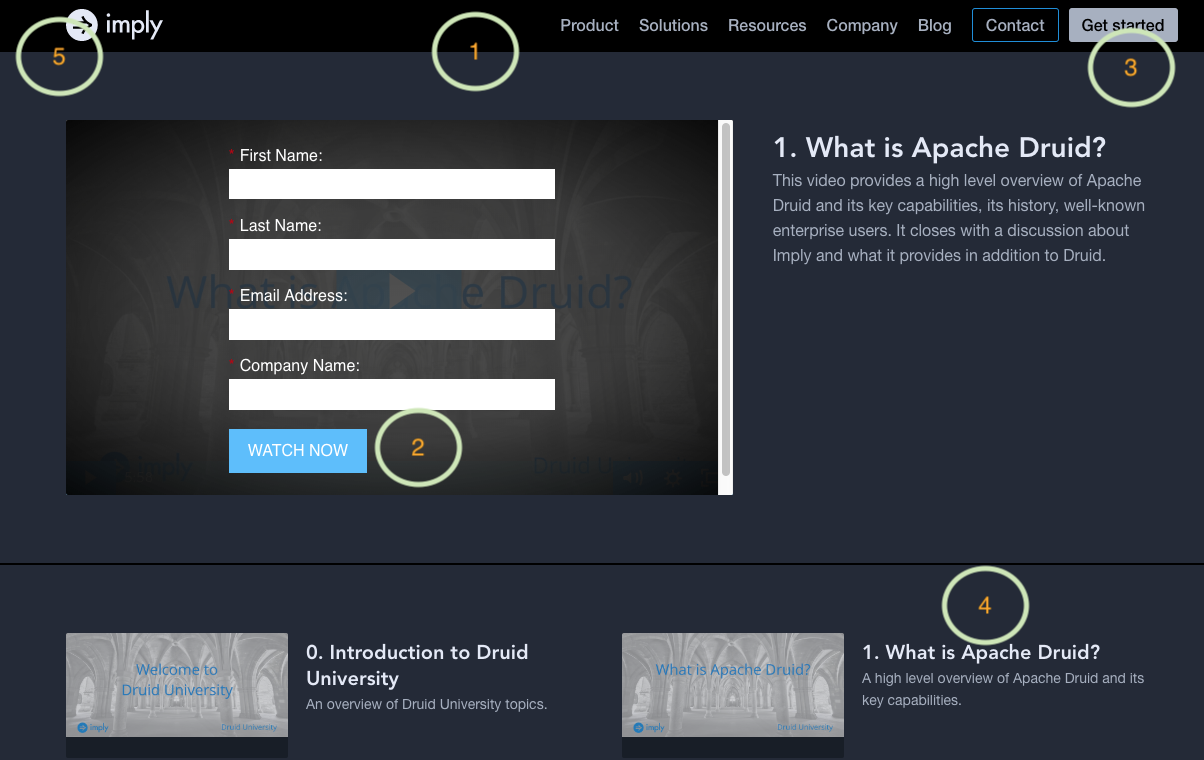
Now we’ve understood the business needs, let’s get technical with a concrete example using the Druid University landing page from imply.io’s website. This example has a funnel that is identical to the one we defined in our earlier examples: the desired objective is to provide the user with valuable information in exchange for their contact details.

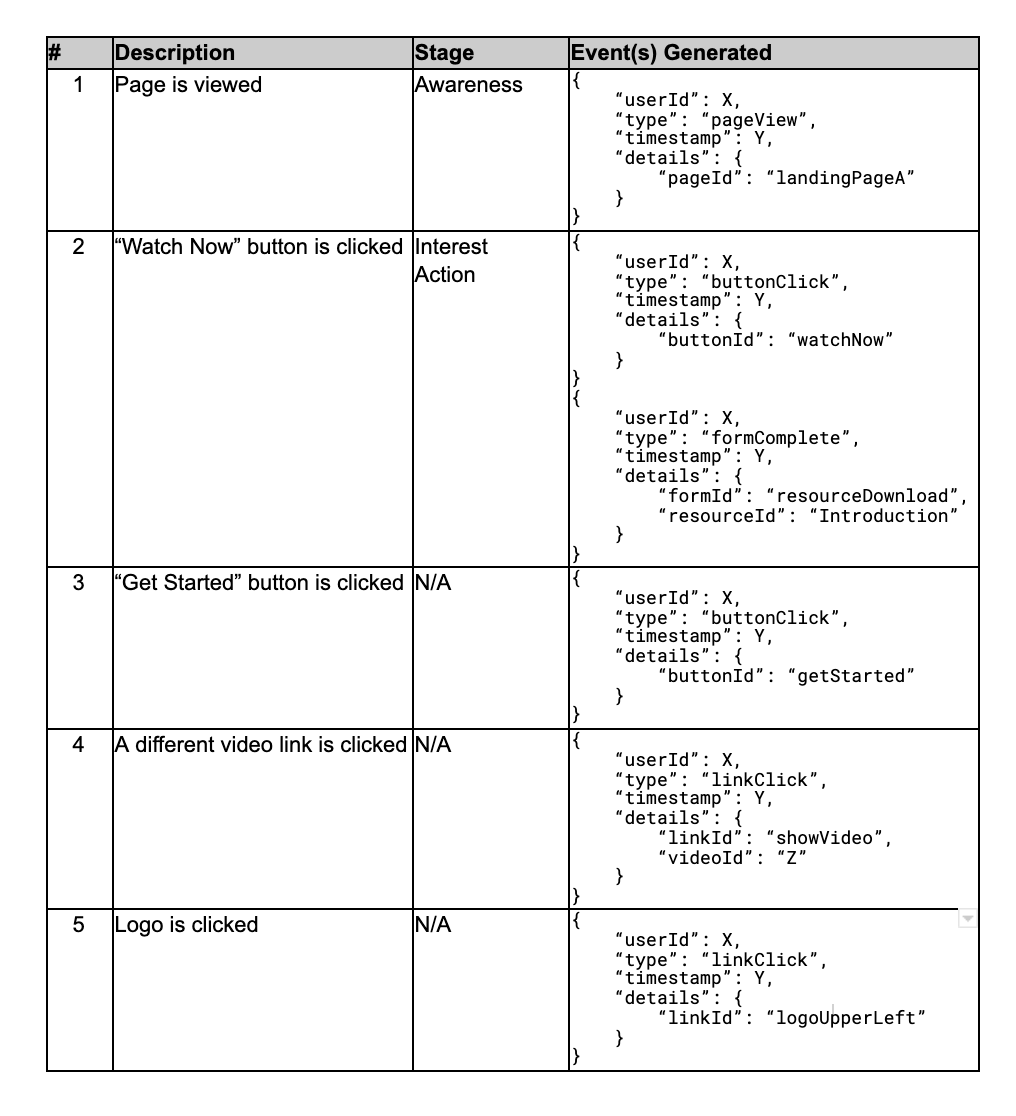
There are a number of user activity events that may be collected on this page. Let’s focus on the 5 highlighted below for this discussion:

Event Collection

In a previous blog post, we discussed using Divolte for collecting user activity events. Whether you use this open source framework or something else, we’ll assume you are ultimately sending these events to a Kafka topic in the JSON format described earlier. We’ll set up Druid to retrieve the events from Kafka.

Data Model

Before we load our data into Druid, let’s take a minute to model the data from our application event data into a Druid datasource named “events”. Druid gives you very fast response times to queries of large datasets. Since performance is usually one of the primary reasons for using Druid, it makes sense to take a minute to think about how the data will be ingested into Druid.

Each row in the datasource will store a single event and its related attributes. Since Druid does not natively store nested objects in a queryable format, we will flatten the details sub-object as part of the ingestion process. For example, the 2 attributes linkId and videoId in the showVideo linkClick details sub-object will become top level link_id and video_id dimensions in the Druid datasource. Similarly, button_id, form_id, and resource_id will be made top-level dimensions from their respective objects. Once complete, the events schema will look like this:

Ingestion

If you have not done so already, download and unpack the latest version of Apache Druid. Whether you are using a full cluster or single node installation, be sure to start the services so they are ready for ingesting data.

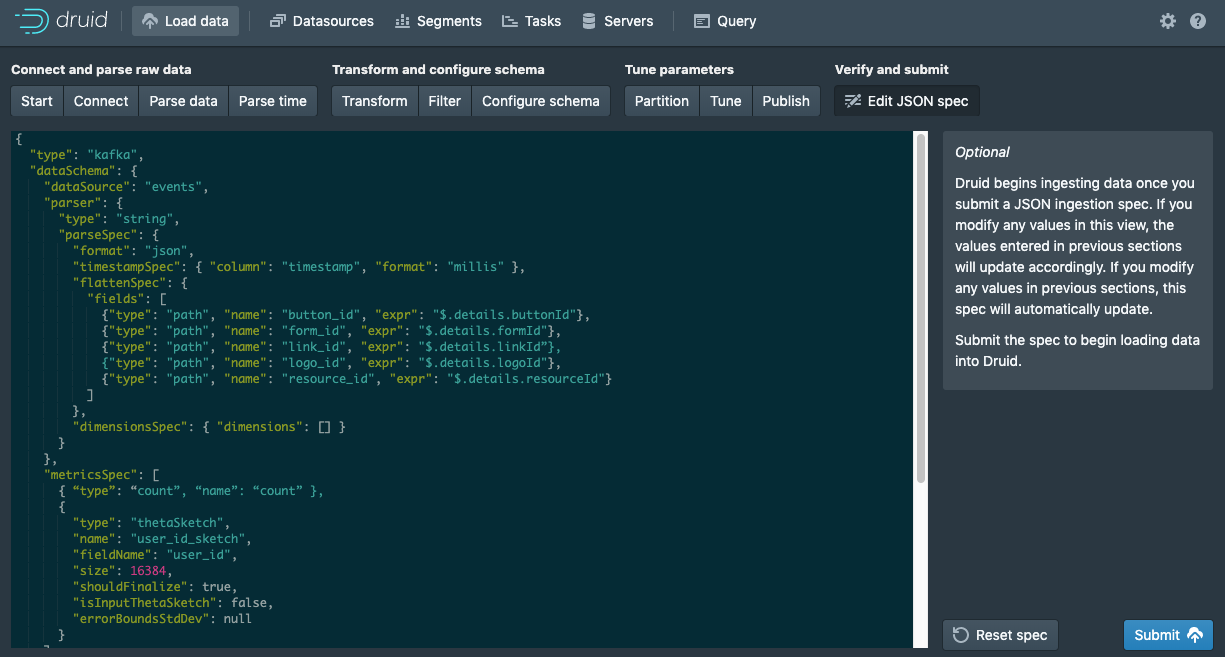
Once the services are started, you can use the visual Data Loader available in Druid 0.15 to set up ingestion from a Kafka topic in minutes. Step through the workflow to build your ingestion spec.

Let’s take a look at an example ingestion spec generated by the Data Loader:

...
{
  "type": "kafka",
  "dataSchema": {
    "dataSource": "events",
    "parser": {
      "type": "string",
      "parseSpec": {
        "format": "json",
        "timestampSpec": { "column": "timestamp", "format": "millis" },
        "flattenSpec": {
          "fields": [
            {"type": "path", "name": "button_id", "expr": "$.details.buttonId"},
            {"type": "path", "name": "form_id", "expr": "$.details.formId"},
            {"type": "path", "name": "link_id", "expr": "$.details.linkId”},
            {"type": "path", "name": "logo_id", "expr": "$.details.logoId"},
            {"type": "path", "name": "resource_id", "expr": "$.details.resourceId"}
          ]
        },
        "dimensionsSpec": { "dimensions": [] }
      }
    },
    "metricsSpec": [
      { “type”: “count”, “name”: “count” },
      {"type": "thetaSketch", "name": "user_id_sketch", "fieldName": "user_id"}
    ],
    "granularitySpec": {
      "type": "uniform",
      "segmentGranularity": "DAY",
      "queryGranularity": { "type": "HOUR" },
      "rollup": true,
      "intervals": null
    }
  },
  "ioConfig": {
    "topic": "events",
    "consumerProperties": {"bootstrap.servers": "127.0.0.1:9092"}
  }
}
...

Notice that you calculate and store the sketch object as a metric with each row in your Druid datasource as you ingest data with this addition to the metricsSpec:

...
      {
        "type": "thetaSketch",
        "name": "user_id_sketch",
        "fieldName": "user_id",
        "size": 16384
      }
...
}

The metric value, computed and stored in user_id_sketch, effectively stores a Set data structure representing an approximation of the unique user_id values. The configurable size represents the maximum number of entries that can be stored. The value of 16384 is the default and is sufficient for most use cases. In the next section, we’ll look at how queries read this value to perform calculations from it.

Before you start loading data, be sure you have added the druid-datasketches extension to your druid.extensions.loadList in common.runtime.properties.

...
druid.extensions.loadList=[“druid-datasketches”]
...

Data rows will begin being ingested once the ingestion spec has been submitted to the Druid overlord. If you are using the Druid Console Data Loader, simply click the Submit button in the Edit JSON spec step. Otherwise, POST the spec to the overlord endpoint.

Query

With data flowing into Druid, we can now start to get answers to our questions.

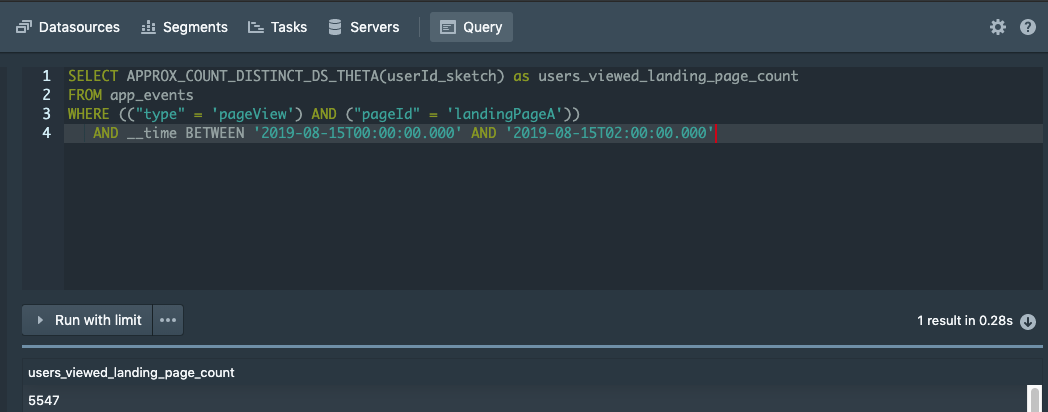
In particular, let’s count the number of users at the first stage of the funnel (i.e., those that viewed the landing page) for a specific 2 hour window (08/15/2019 00:00 – 02:00):

SELECT APPROX_COUNT_DISTINCT_DS_THETA(user_id_sketch) as users_viewed_landing_page_count
  FROM app_events
 WHERE (("type" = 'pageView') AND ("page_id" = 'landingPageA'))
   AND __time BETWEEN '2019-08-15T00:00:00.000' AND '2019-08-15T02:00:00.000'

Using SQL, the APPROX_COUNT_DISTINCT_DS_THETA function is used to calculate the number of unique users from the pre-computed theta sketch and the associated library. We can run a similar query to get the results of each stage of the funnel. For example, to count the users in stage 2 who clicked the “Watch Now” button, we run this query:

SELECT APPROX_COUNT_DISTINCT_DS_THETA(user_id_sketch) as users_clicked_download_count
  FROM app_events
 WHERE (("type" = ‘buttonClick’) AND ("button_id" = ‘watchNow’))
   AND __time BETWEEN '2019-08-15T00:00:00.000' AND '2019-08-15T02:00:00.000'

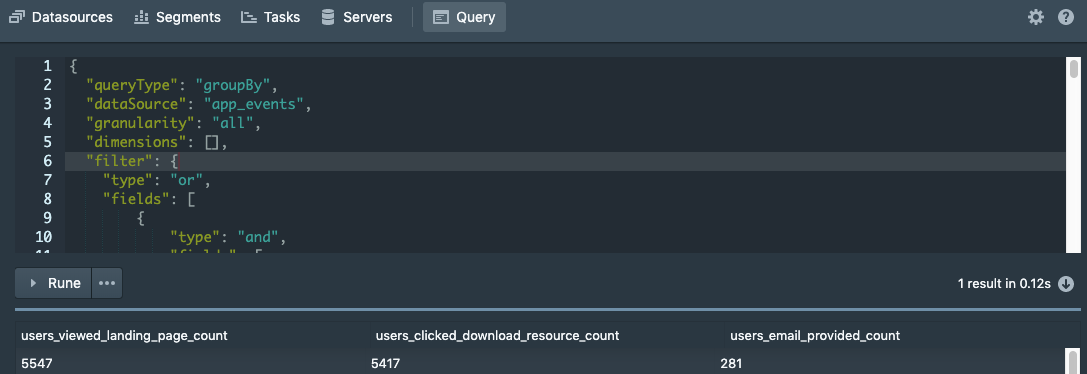
If you are more comfortable with the native Druid query language, you can write the above two queries in one using this query:

{
  "queryType": "groupBy",
  "dataSource": "events",
  "granularity": "all",
  "dimensions": [],
  "filter": {
    "type": "or",
    "fields": [
        {
            "type": "and",
            "fields": [
                {"type": "selector","dimension": "type","value": "pageView"},
                {"type": "selector","dimension": "page_id","value": "landingPageA"}
            ]
        },
        {
            "type": "and",
            "fields": [
                {"type": "selector","dimension": "type","value": "buttonClick"},
                {"type": "selector","dimension": "button_id",”value”: "watchNow"}
            ]
        }
    ]
  },
  "aggregations": [
    {
      "type" : "filtered",
      "filter" : {
          "type": "and",
          "fields": [
              {"type": "selector","dimension": "type","value": "pageView"},
              {"type": "selector","dimension": "page_id","value": "landingPageA"}
          ]
      },
      "aggregator" : {
          "type": "thetaSketch",
          "name": "users_viewed_landing_page_count",
          "fieldName": "user_id_sketch"
      }
    },
    {
      "type" : "filtered",
      "filter" : {
          "type": "and",
          "fields": [
              {"type": "selector","dimension": "type","value": "formComplete"},
              {"type": "selector","dimension": "button_id",”value”: "watchNow"}
          ]
      },
      "aggregator" :     {
          "type": "thetaSketch",
          "name": "users_clicked_download_resource_count",
          "fieldName": "user_id_sketch"
      }
    }
  ],
  "intervals": ["2019-08-15T00:00:00.000/2019-08-15T02:00:00.000"]
}

You can run this query from the Druid Console Query tab or by simply sending a POST request to the Druid Broker or Router.

The results will show you how many users completed the first two steps of the funnel.

The native query language provides us with some additional benefits including post aggregations that open up additional possibilities. For example, recall that the theta sketch value is, in essence, a Set data structure that maintains a unique set of user. Because of this we can perform set operations such as union and intersection on the results.

In some instances, it may be helpful to perform an intersection of users who performed 2 steps. That is, intersect the group of users that performed step 1 with those that performed step 2 and output the results showing everyone who did both step 1 and step 2. In our example, you cannot click the “Watch Now” button without first viewing the page so this intersection is not needed. But, if it were required, you would simply add a post aggregation to your native query:

...
"postAggregations": [
    {
      "type": "thetaSketchEstimate",
      "name": "users_email_provided_count",
      "field":
      {
        "type": "thetaSketchSetOp",
        "name": "users_email_provided_count",
        "func": "INTERSECT",
        "fields": [
          {"type": "fieldAccess","fieldName": "users_viewed_landing_page_count"},
          {"type": "fieldAccess","fieldName": "users_clicked_download_resource_count"}
        ]
      }
    }
  ],
...

Visualize

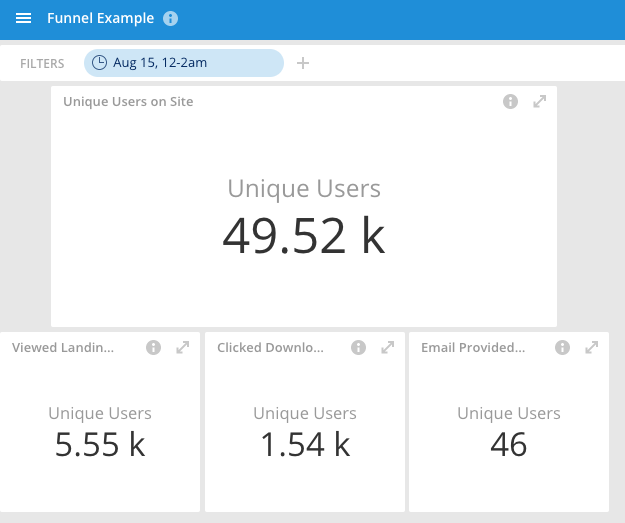
You aren’t limited to running SQL or native queries to get results. You can also use visualization tools like Imply Pivot, or your favorite traditional UI (e.g. Tableau, Looker) to create a dashboard and drag-and-drop interactive charts showing you the results in a live view:

These tools make the data more accessible to non-technical users and allow you to compare one week to another or one version to another with ease.

Summary

Over the past two decades the business world has been instrumented to capture every transaction and interaction as it happens. Thus clickstream analysis has evolved from being a website performance method to one that captures an increasing range of business performance metrics, by processing a wide variety of data at tremendous speed and scale.

Using Apache Druid along with the Data Sketches library provides a fast and scalable design to analyze conversion funnels that synthesize billions of rows of data for dozens or hundreds of concurrent users. If your current tools can no longer scale to meet the load of your users and the magnitude of events collected, then check out how Druid can help.

A great way to get hands-on with Druid is through a Free Imply Download or Imply Cloud Trial.

Other blogs you might find interesting

No records found...
Mar 21, 2024

How GameAnalytics Provides Flexible Data Exploration with Imply

Learn how GameAnalytics, the leading analytics provider for the gaming industry, provides insights on over 100,000 games, 1.75 billion players, and 24 billion monthly sessions.

Learn More
Mar 04, 2024

Smart Devices, Intelligent Insights: How Rivian and Thing-it use Apache Druid for IoT Analytics

Learn how engineers and architects from electric vehicle manufacturer Rivian and smart asset management platform Thing-it use Apache Druid for their IoT analytics environments.

Learn More
Feb 21, 2024

What’s new in Imply Polaris – January 2024

At Imply, we're excited to share the latest enhancements in Imply Polaris, our real-time analytics Database-as-a-Service (DBaaS) powered by Apache Druid®. Our commitment to refining your experience with Polaris...

Learn More
Feb 21, 2024

Introducing Apache Druid 29.0

Apache Druid® is an open-source distributed database designed for real-time analytics at scale. We are excited to announce the release of Apache Druid 29.0. This release contains over 350 commits & 67 contributors.

Learn More
Feb 14, 2024

Apache Druid vs. ClickHouse

If your project needs a real-time analytics database that provides subsecond performance at scale you should consider both Apache Druid and ClickHouse. Find out how to make an informed choice.

Learn More
Jan 23, 2024

Enhancing Data Security with Role-Based Access Control in Druid and Imply

Managing user access to relevant data is a crucial aspect of any data platform. In a typical Role Based Access Control (RBAC) setup, users are assigned roles that determine their access to relevant data. We...

Learn More
Jan 16, 2024

Comparing Data Formats for Analytics: Parquet, Iceberg, and Druid Segments

In this blog, I will give you a detailed overview of each choice. We will cover key features, benefits, defining characteristics, and provide a table comparing the file formats. Dive in and explore the characteristics...

Learn More
Jan 12, 2024

Scheduling batch ingestion with Apache Airflow

This guide is your map to navigating the confluence of Airflow and Druid for smooth batch ingestion. We'll get you started by showing you how to setup Airflow and the Druid Provider and use it to ingest some...

Learn More
Dec 29, 2023

A Buyer’s Guide to OLAP Tools

How do OLAP databases work—and which one is right for you? Read this blog post to learn more about which OLAP solutions are best for different use cases.

Learn More
Dec 26, 2023

What is IoT Analytics?

Because it deals with fast-moving, real-time data, IoT analytics is uniquely challenging. Learn how to overcome these challenges and how to extract (and act on) valuable insights from IoT data.

Learn More
Dec 19, 2023

OLTP and OLAP Databases: How They Differ and Where to Use Them

Learn about the differences between analytical and transactional databases—their strengths and weaknesses, what they’re used for, and which option to choose for your own use case.

Learn More
Dec 15, 2023

Query from deep storage: Introducing a new performance tier in Apache Druid

Now, Druid offers a simpler, cost-effective solution with its new feature, Query from Deep Storage. This feature enables you to query Druid’s deep storage layer directly without having to preload all of your...

Learn More
Dec 15, 2023

How KakaoBank Uses Imply for Financial Analysis

As a mobile-first digital platform, KakaoBank accumulates a substantial amount of data. Therefore, analysts need a solution that can effectively analyze and pre-process large quantities of data, visualize the...

Learn More
Dec 14, 2023

Joins, Multi-Stage Queries, and More: Relive the Excitement of Druid Summit 2023

Druid Summit kicked off its fourth year as a global gathering of minds passionate about real-time analytics and the power of Apache Druid. This year’s event revealed a common theme: the growing significance...

Learn More
Dec 13, 2023

An Introduction to Online Analytical Processing (OLAP)

Online analytical processing (OLAP) analyzes data at scale—and provides actionable insights to organizations. Learn about how OLAP works, what a data cube is, and which OLAP product to use.

Learn More
Dec 12, 2023

Real-Time Data: What it is, Why it Matters, and More

Real-time data travels directly from the source to end users, so that it can be processed and acted on instantly. Learn all about the challenges, benefits, and best practices for real-time data.

Learn More
Dec 08, 2023

Druid vs Pinot: Choosing the best database for Real-Time Analytics

Do you want fast analytics, with subsecond queries, high concurrency, and combination of streams and batch data? If so, you want real-time analytics, and you probably want to consider the two Apache Software...

Learn More
Dec 07, 2023

What’s new in Imply Polaris – October and November 2023

At Imply, our commitment to continually improving your experience with Imply Polaris—our real-time analytics Database-as-a-Service (DBaaS) powered by Apache Druid®—is evident in recent developments. Over...

Learn More
Nov 15, 2023

Introducing Apache Druid 28.0.0

Apache Druid 28.0, an open-source database for real-time analytics, introduces Async queries, UNION ALL support, SQL WINDOW functions, enhanced ingestion features, including multi-Kafka topic support, and...

Learn More
Oct 18, 2023

Migrating Data From S3 To Apache Druid

This blog covers the rationale, advantages, and step-by-step process for data transfer from AWS s3 to Apache Druid for faster real-time analytics and querying.

Learn More
Oct 12, 2023

What’s new in Imply Polaris, our real-time analytics DBaaS  – September 2023

Every week, we add new features and capabilities to Imply Polaris. Throughout September, we've focused on enhancing your experience as you explore trials, navigate data integration, oversee data management,...

Learn More
Sep 27, 2023

Introducing incremental encoding for Apache Druid dictionary encoded columns

In this blog post we deep dive on a recent engineering effort: incremental encoding of STRING columns. In preliminary testing, it has shown to be quite promising at significantly reducing the size of segment...

Learn More
Sep 21, 2023

Migrate Analytics Data from MongoDB to Apache Druid

This blog presents a concise guide on migrating data from MongoDB to Druid. It includes Python scripts to extract data from MongoDB, save it as CSV, and then ingest it into Druid. It also touches on maintaining...

Learn More
Sep 21, 2023

How Druid Facilitates Real-Time Analytics for Mass Transit

Mass transit plays a key role in reimagining life in a warmer, more densely populated world. Learn how Apache Druid helps power data and analytics for mass transit.

Learn More
Sep 19, 2023

Migrate Analytics Data from Snowflake to Apache Druid

This blog outlines the steps needed to migrate data from Snowflake to Apache Druid, a platform designed for high-performance analytical queries. The article covers the migration process, including Python scripts...

Learn More
Sep 15, 2023

Apache Kafka, Flink, and Druid: Open Source Essentials for Real-Time Data Applications

Apache Kafka, Flink, and Druid, when used together, create a real-time data architecture that eliminates all these wait states. In this blog post, we’ll explore how the combination of these tools enables...

Learn More
Sep 11, 2023

Visualizing Data in Apache Druid with the Plotly Python Library

In today's data-driven world, making sense of vast datasets can be a daunting task. Visualizing this data can transform complicated patterns into actionable insights. This blog delves into the utilization of...

Learn More
Sep 05, 2023

Bringing Real-Time Data to Solar Power with Apache Druid

In a rapidly warming world, solar power is critical for decarbonization. Learn how Apache Druid empowers a solar equipment manufacturer to provide real-time data to users, from utility plant operators to homeowners

Learn More
Sep 05, 2023

When to Build (Versus Buy) an Observability Application

Observability is the key to software reliability. Here’s how to decide whether to build or buy your own solution—and why Apache Druid is a popular database for real-time observability

Learn More
Aug 29, 2023

How Innowatts Simplifies Utility Management with Apache Druid

Data is a key driver of progress and innovation in all aspects of our society and economy. By bringing digital data to physical hardware, the Internet of Things (IoT) bridges the gap between the online and...

Learn More
Aug 14, 2023

Three Ways to Use Apache Druid for Machine Learning Workflows

An excellent addition to any machine learning environment, Apache Druid® can facilitate analytics, streamline monitoring, and add real-time data to operations and training

Learn More
Aug 11, 2023

Introducing Apache Druid 27.0.0

Apache Druid® is an open-source distributed database designed for real-time analytics at scale. Apache Druid 27.0 contains over 350 commits & 46 contributors. This release's focus is on stability and scaling...

Learn More
Aug 10, 2023

Unleashing Real-Time Analytics in APJ: Introducing Imply Polaris on AWS AP-South-1

Imply, the company founded by the original creators of Apache Druid, has exciting news for developers in India seeking to build real-time analytics applications. Introducing Imply Polaris, a powerful database-as-a-Service...

Learn More
Aug 03, 2023

Embedding Visualizations using React and Express

In this guide, we will walk you through creating a very simple web app that shows a different embedded chart for each user selected from a drop-down. While this example is simple it highlights the possibilities...

Learn More
Jul 25, 2023

Apache Druid: Making 1000+ QPS for Analytics Look Easy

This 2-part blog post explores key technical considerations to support high QPS for analytics and the strengths of Apache Druid

Learn More
Jul 25, 2023

Things to Consider When Scaling Analytics for High QPS

This 2-part blog post explores key technical considerations to support high QPS for analytics and the strengths of Apache Druid

Learn More
Jul 20, 2023

Automate Streaming Data Ingestion with Kafka and Druid

In this blog post, we explore the integration of Kafka and Druid for data stream management and analysis, emphasizing automatic topic detection and ingestion. We delve into the creation of 'Ingestion Spec',...

Learn More
Jul 12, 2023

Schema Auto-Discovery with Apache Druid

This guide explores configuring Apache Druid to receive Kafka streaming messages. To demonstrate Druid's game-changing automatic schema discovery. Using a real-world scenario where data changes are handled...

Learn More
Jul 11, 2023

What’s new in Imply Polaris – Q2 2023

Imply Polaris, our ever-evolving Database-as-a-Service, recently focused on global expansion, enhanced security, and improved data handling and visualization. This fully managed cloud service, based on Apache...

Learn More
Jun 06, 2023

Introducing hands-on developer tutorials for Apache Druid

The objective of this blog is to introduce the new set of interactive tutorials focused on the Druid API fundamentals. These tutorials are available as Jupyter Notebooks and can be downloaded as a Docker container.

Learn More
Jun 01, 2023

Introducing Schema Auto-Discovery in Apache Druid

In this blog article I’ll unpack schema auto-discovery, a new feature now available in Druid 26.0, that enables Druid to automatically discover data fields and data types and update tables to match changing...

Learn More
May 30, 2023

Exploring Unnest in Druid

Druid now has a new function, Unnest. Unnest explodes an array into individual elements. This blog contains design methodology and examples for this new Unnest function both from native and SQL binding perspectives.

Learn More
May 28, 2023

What’s new in Imply Polaris – Our Real-Time Analytics DBaaS

Every week we add new features and capabilities to Imply Polaris. This month, we’ve expanded security capabilities, added new query functionality, and made it easier to monitor your service with your preferred...

Learn More
May 24, 2023

Introducing Apache Druid 26.0

Apache Druid® 26.0, an open-source distributed database for real-time analytics, has seen significant improvements with 411 new commits, a 40% increase from version 25.0. The expanded contributor base of 60...

Learn More
May 22, 2023

ACID and Apache Druid

ACID and Druid, an interesting dive into some of the Druid capabilities in the light of ACID compliance

Learn More
May 21, 2023

How to Build a Sentiment Analysis Application with ChatGPT and Druid

Leveraging ChatGPT for sentiment analysis, when combined with Apache Druid, offers results from large data volumes. This integration is easily achievable, revealing valuable insights and trends for businesses...

Learn More
May 21, 2023

Snowflake and Apache Druid

In this blog, we will compare Snowflake and Druid. It is important to note that reporting data warehouses and real-time analytics databases are different domains. Choosing the right tool for your specific requirements...

Learn More
May 20, 2023

Learn how to achieve sub-second responses with Apache Druid

Learn how to achieve sub-second responses with Apache Druid. This article is an in-depth look at how Druid resolves queries and describes data modeling techniques that improve performance.

Learn More
May 19, 2023

Apache Druid – Recovering Dropped Segments

Apache Druid uses load rules to manage the ageing of segments from one historical tier to another and finally to purge old segments from the cluster. In this article, we’ll show what happens when you make...

Learn More
May 18, 2023

Real-Time Analytics: Building Blocks and Architecture

This blog identifies the key technical considerations for real-time analytics. It answers what is the right data architecture and why. It spotlights the technologies used at Confluent, Reddit, Target and 1000s...

Learn More
May 17, 2023

Transactions Come and Go, but Events are Forever

For decades, analytics has focused on Transactions. While Transactions are still important, the future of analytics is understanding Events.

Learn More
May 16, 2023

What’s new in Imply Polaris – Our Real-Time Analytics DBaaS

This blog explains some of the new features, functionality and connectivity added to Imply Polaris over the last two months. We've expanded ingestion capabilities, simplified operations and increased reliability...

Learn More
May 15, 2023

Elasticsearch and Druid

This blog will help you understand what Elasticsearch and Druid do well and will help you decide whether you need one or both to reach your goals

Learn More
May 14, 2023

Wow, that was easy – Up and running with Apache Druid

The objective of this blog is to provide a step-by-step guide on setting up Druid locally, including the use of SQL ingestion for importing data and executing analytical queries.

Learn More
May 13, 2023

Top 7 Questions about Kafka and Druid

Read on to learn more about common questions and answers about using Kafka with Druid.

Learn More
May 12, 2023

Tales at Scale Podcast Kicks off with the Apache Druid Origin Story

Tales at Scale cracks open the world of analytics projects and shares stories from developers and engineers who are building analytics applications or working within the real-time data space. One of the key...

Learn More
May 11, 2023

Real-time Analytics Database uses partitioning and pruning to achieve its legendary performance

Apache Druid uses partitioning (splitting data) and pruning (selecting subset of data) to achieve its legendary performance. Learn how to use the CLUSTERED BY clause during ingestion for performance and high...

Learn More
May 10, 2023

Easily embed analytics into your own apps with Imply’s DBaaS

This blog explains how developers can leverage Imply Polaris to embed robust visualization options directly into their own applications without them having to build a UI. This is super important because consuming...

Learn More
May 09, 2023

Building an Event Analytics Pipeline with Confluent Cloud and Imply’s real time DBaaS, Polaris

Learn how to set up a pipeline that generates a simulated clickstream event stream and sends it to Confluent Cloud, processes the raw clickstream data using managed ksqlDB in Confluent Cloud, delivers the processed...

Learn More
May 08, 2023

Real time DBaaS comes to Europe

We are excited to announce the availability of Imply Polaris in Europe, specifically in AWS eu-central-1 region based in Frankfurt. Since its launch in March 2022, Imply Polaris, the fully managed Database-as-a-Service...

Learn More
May 07, 2023

Stream big, think bigger—Analyze streaming data at scale in 2023

Imply is predicting the next "big thing" in 2023 will be analyzing streaming data in real time (and Druid is built for just that!)

Learn More
May 07, 2023

Should You Build or Buy Security Analytics for SecOps?

When should you build—or buy—a security analytics platform for your environment? Here are some common considerations—and how Apache Druid is the ideal foundation for any in-house security solution.

Learn More
May 05, 2023

Introducing Apache Druid 25.0

Apache Druid 25.0 contains over 293 updates from over 56 contributors.

Learn More
May 03, 2023

Druid and SQL syntax

This is a technical blog, which summarises the process of extending the Druid's SQL grammar for ingestion and delves into the nitty gritty of Calcite.

Learn More
May 02, 2023

Native support for semi-structured data in Apache Druid

Describes a new feature- ingest complex data as is into Druid- massive improvement in developer productivity

Learn More
May 01, 2023

Real-Time Analytics with Imply Polaris: From Setup to Visualization

Imply Polaris offers reduced operational overhead and elastic scaling for efficient real-time analytics that helps you unlock your data's potential.

Learn More
May 01, 2023

Datanami Award

Apache Druid won Datanami's 2022 Readers’ and Editors’ Choice Awards for Reader's Choice "Best Data and AI Product or Technology: Analytics Database".

Learn More
Apr 30, 2023

Alerting and Security Features in Polaris

Describes new features - alerts and some security features- and how Imply customers can leverage it

Learn More
Apr 29, 2023

Ingestion from Amazon Kinesis and S3 into Imply Polaris

Imply Polaris now supports data ingestion from Amazon Kinesis and Amazon S3

Learn More
Apr 27, 2023

Getting the Most Out of your Data

Ingesting data from one table to another is easy and fast in Imply Polaris!

Learn More
Apr 26, 2023

Combating financial fraud and money laundering at scale with Apache Druid

Learn how Apache Druid enables financial services firms and FinTech companies to get immediate insights from petabytes-plus data volumes for anti-fraud and anti-money laundering compliance.

Learn More
Apr 26, 2023

What’s new in Imply – December 2022

This is a what's new to Imply in Dec 2022. We’ve added two new features to Imply Polaris to make it easier for your end users to take advantage of real-time insights.

Learn More
Apr 25, 2023

What’s New in Imply Polaris – November 2022

This blog provides an overview for the new features, functionality, and connectivity to Imply Polaris for November 2022.

Learn More
Apr 24, 2023

Imply Pivot delivers the final mile for modern analytics applications

This blog is focused on how Imply Pivot delivers the final mile for building an anlaytics app. It showcases two customer examples - Twitch and ironsource.

Learn More
Apr 23, 2023

Why Analytics Need More than a Data Warehouse

For decades, analytics has been defined by the standard reporting and BI workflow, supported by the data warehouse. Now, 1000s of companies are realizing an expansion of analytics beyond reporting, which requires...

Learn More
Apr 21, 2023

Why Open Source Matters for Databases

Apache Druid is at the heart of Imply. We’re an open source business, and that’s why we’re committed to making Druid the best open source database for modern analytics applications

Learn More
Apr 20, 2023

Ingestion from Confluent Cloud and Kafka in Polaris

How to ingest data into Imply Polaris from Confluent Cloud and from Apache Kafka

Learn More
Apr 18, 2023

What Makes a Database Built for Streaming Data?

For an analytics app to handle real-time, streaming sources, it must be built for streaming data. Druid has 3 essential features for stream data.

Learn More
Oct 12, 2022

SQL-based Transformations and JSON Columns in Imply Polaris

You can easily do data transformations and manage JSON data with Imply Polaris, both using SQL.

Learn More
Oct 06, 2022

Approximate Distinct Counts in Imply Polaris

When it comes to modern data analytics applications, speed is of the utmost importance. In this blog we discuss two approximation algorithms which can be used to greatly enhance speed with only a slight reduction...

Learn More
Sep 20, 2022

The next chapter for Imply Polaris: celebrating 250+ accounts, continued innovation

Today we announced the next iteration of Imply Polaris, the fully managed Database-as-a-Service that helps you build modern analytics applications faster, cheaper, and with less effort. Since its launch in...

Learn More
Sep 20, 2022

Introducing Imply’s Total Value Guarantee for Apache Druid

Apache Druid 24.0 contains 450 updates and new features, major performance enhancements, bug fixes, and major documentation improvements

Learn More
Sep 16, 2022

Introducing Apache Druid 24.0

Apache Druid 24.0 contains 450 updates and new features, major performance enhancements, bug fixes, and major documentation improvements

Learn More
Aug 16, 2022

Using Imply Pivot with Druid to Deduplicate Timeseries Data

Imply Pivot offers multi step aggregations, which is valuable for timeseries data where measures are not evenly distributed in time.

Learn More
Jul 21, 2022

A Look Under the Surface at Polaris Security

We have taken a security-first approach in building the easiest real-time database for modern analytics applications.

Learn More
Jul 14, 2022

Upserts and Data Deduplication with Druid

A look at what can be done with Druid for upserts and data deduplication.

Learn More
Jul 01, 2022

What Developers Can Build with Apache Druid

We obviously talk a lot about #ApacheDruid on here. But what are folks actually building with Druid? What is a modern analytics application, exactly? Let's find out

Learn More
Jun 29, 2022

When Streaming Analytics… Isn’t

Nearly all databases are designed for batch processing, which leaves three options for stream analytics.

Learn More
Jun 29, 2022

Apache Druid vs. Snowflake

Elasticity is important, but beware the database that can only save you money when your application is not in use. The best solution will have excellent price-performance under all conditions.

Learn More
Jun 22, 2022

Druid 0.23 – Features And Capabilities For Advanced Scenarios

Many of Druid’s improvements focus on building a solid foundation, including making the system more stable, easier to use, faster to scale, and better integrated with the rest of the data ecosystem. But for...

Learn More
Jun 22, 2022

Introducing Apache Druid 0.23

Apache Druid 0.23.0 contains over 450 updates, including new features, major performance enhancements, bug fixes, and major documentation improvements.

Learn More
Jun 20, 2022

An Opinionated Guide to Component APIs

We have collected a number of guidelines for React component APIs that make components more predictable in terms of behavior and performance.

Learn More
Jun 10, 2022

Druid Architecture & Concepts

In a world full of databases, learn how Apache Druid makes real-time analytics apps a reality in this Whitepaper from Imply

Learn More
May 25, 2022

3 decisions that shaped the Polaris UI

Imply Polaris is a fully managed database-as-a-service for building realtime analytics applications. John is the tech lead for the Polaris UI, known internally as the Unified App. It began with a profound question:...

Learn More
May 19, 2022

How Imply Polaris takes a security-first approach

A primer for developers on security tools and controls available in Imply Polaris

Learn More
May 17, 2022

Imply Raises $100MM in Series D funding

There is a new category within data analytics emerging which is not centered in the world of reports and dashboards (the purview of data analysts and data scientists), but instead centered in the world of applications...

Learn More
May 11, 2022

Imply Named “Cool Database Vendor” by CRN

There can’t be one database good at everything. When it comes to real-time analytics, you need a database built for it.

Learn More
May 11, 2022

Living the Stream

We are in the early stages of a stream revolution, as developers build modern transactional and analytic applications that use real-time data continuously delivered.

Learn More
May 02, 2022

Migrating Data from ClickHouse to Imply Polaris

In this blog, we’ll review the simple steps to export data from ClickHouse in a format that is easy to ingest into Polaris.

Learn More

Let us help with your analytics apps

Request a Demo