We are extremely excited to announce Imply 2.1, a feature-packed release,available now for download. Native SQL comes to Druid and dashboarding is now possible in Pivot. You can find out more below:
Below, we’re excited to share some highlights from this Druid release!
Built-in SQL
Druid now includes a built-in SQL server powered by Apache Calcite. Druid provides two SQL APIs: HTTP POST and JDBC. This provides an alternative to Druid’s native JSON API which is more familiar to new developers, and which makes it easier to integrate pre-existing applications that natively speak SQL. Not all Druid and SQL features are supported by the SQL layer in this initial release, but we intend to expand both in future releases.
Numeric dimensions
Druid now supports numeric dimensions at ingestion and query time. Users can ingest long and float columns as dimensions (i.e., treating the numeric columns as part of the ingestion-time grouping key instead of as aggregators, if rollup is enabled). Additionally, Druid queries can now accept any long or float column as a dimension for grouping or for filtering.
There are performance tradeoffs between string and numeric columns. Numeric columns are generally faster to group on than string columns. Numeric columns don’t have indexes, so they are generally slower to filter on than string columns.
Other highlights
Druid 0.10.0 contains hundreds of other performance improvements, stability improvements, and bug fixes from over 40 contributors. In addition to the built-in SQL layer and numeric dimensions, this release also includes:
A revamp of the “index” task
A new “like” filter
Large column support
Ability to run the coordinator and overlord as a single service
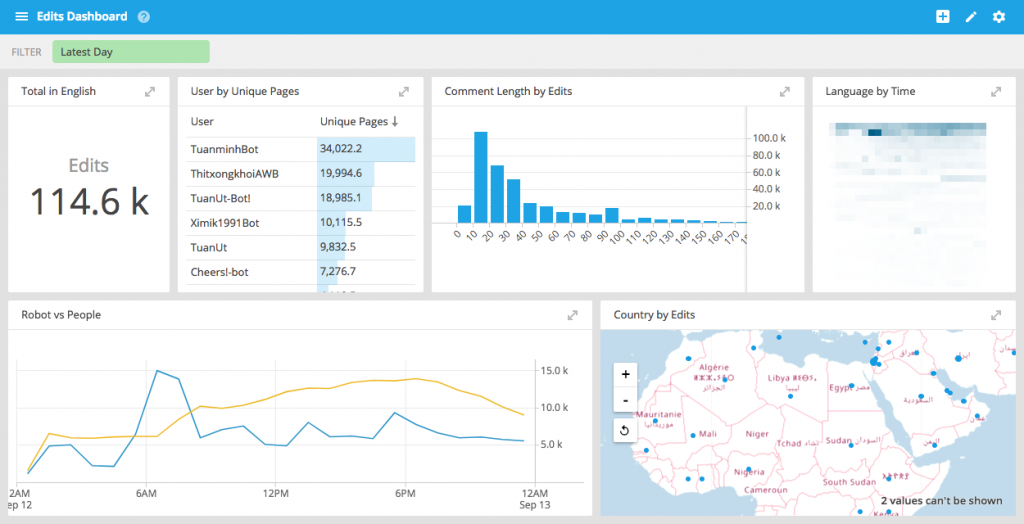
In addition to the Druid update, Imply 2.1 also includes an all-new version of Pivot which supports interactive dashboards along with lots of other new features.
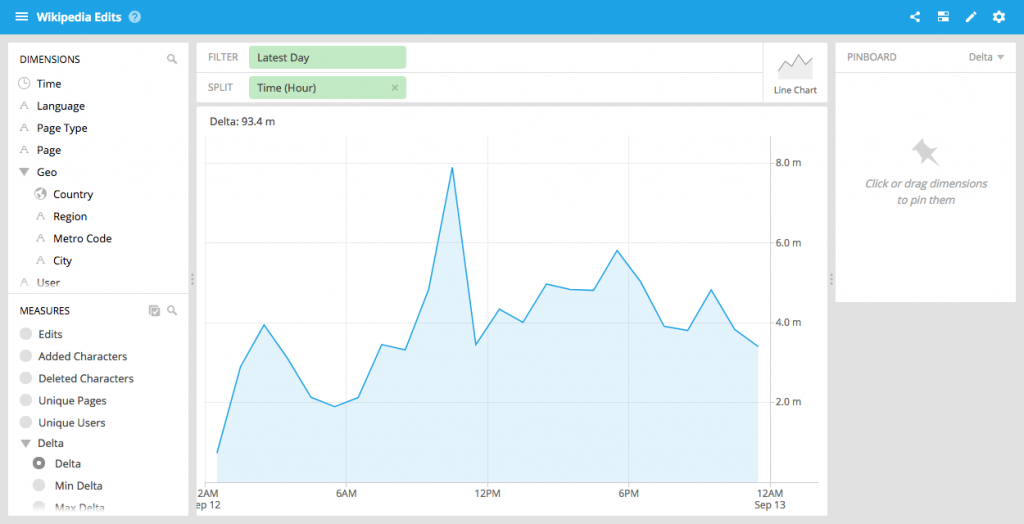
Interactive dashboards
We have extended the collection functionality from our last release to allow for more customizable dashboard layouts. You can turn on “shared filters”, which means that interacting with one visualization applies a filter across the dashboard.
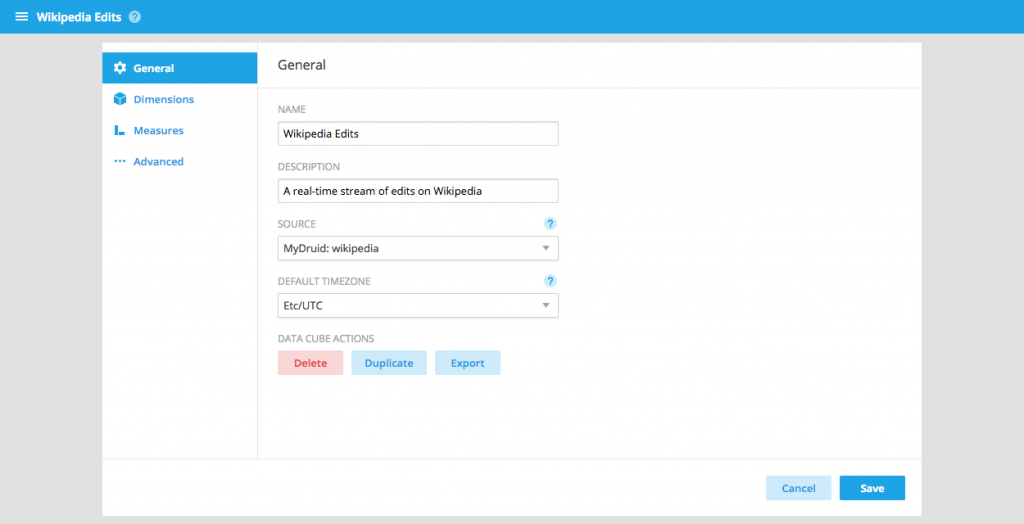
Easy data cube editing
Data cube editing is now simpler than ever.
Just click the pencil icon to go to the edit mode, where you can change dimensions, measures and general preferences.
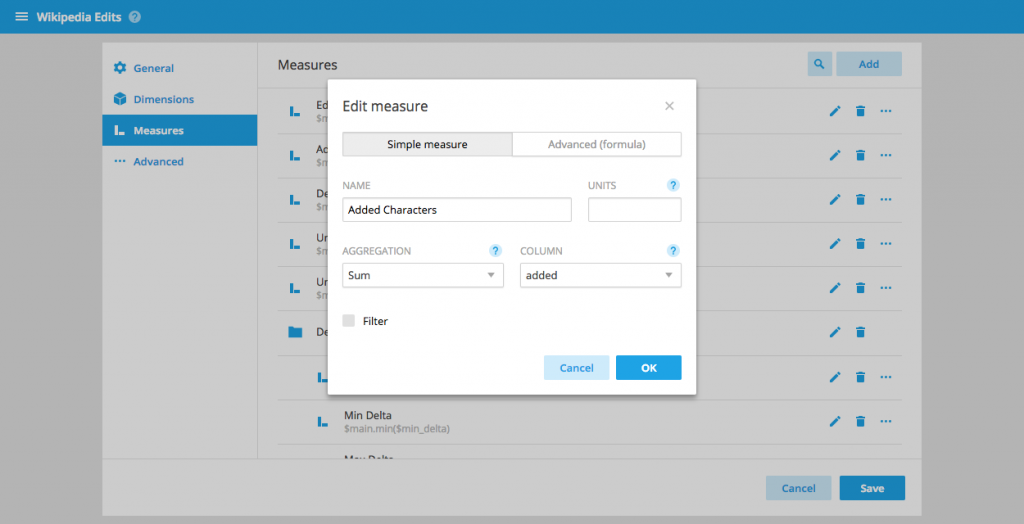
Simple measure editor
You can now create simple measures without writing any code.
You can still create complex measures by going to the Advanced tab. For example, to create a measure expressing the percentage of revenue form the United State enter the following Plywood formula: $main.filter($country == 'United States').sum($revenue) / $main.sum($revenue) from the advanced tab.
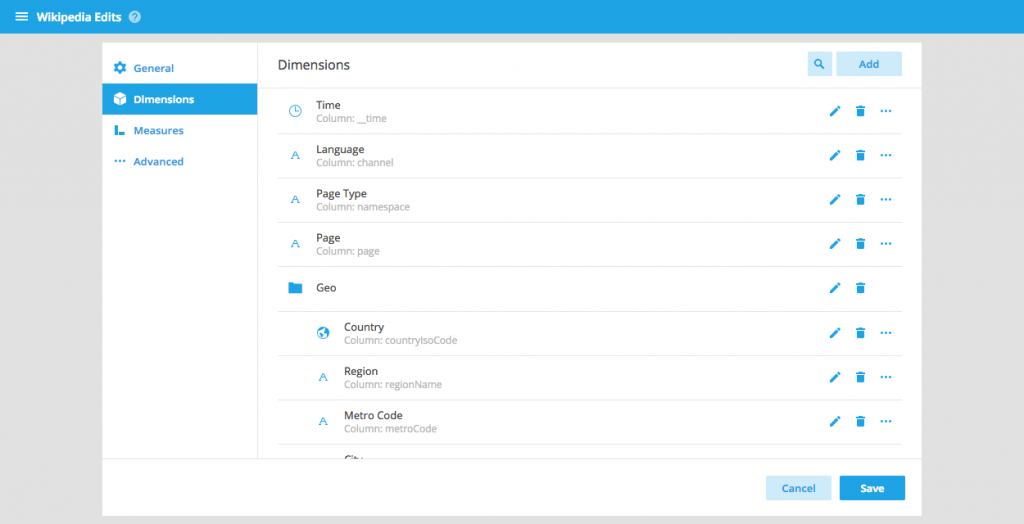
Grouped dimensions and measures
You can now put dimensions and measures into groups. The groups allow you to save space and express closeness of relationship.
You simply create a dimension and measure groups from the data cube edit mode, and drag items to add them to groups.
Other improvements
In addition to all of the above we also made Pivot leverage all of the new query features of Druid 0.10.0.In particular Pivot will minimize the use of JavaScript aggregators and post-aggregators to optimize performance and increase security.
Getting started
You can get the latest version of Imply on our download page. To learn more, please see our documentation. Any feedback, bug reports and feature requests are always welcome – you can post them in our user group or contact us.
Other blogs you might find interesting
No records found...
Jul 23, 2024
Streamlining Time Series Analysis with Imply Polaris
We are excited to share the latest enhancements in Imply Polaris, introducing time series analysis to revolutionize your analytics capabilities across vast amounts of data in real time.
Transform your data management with upserts in Imply Polaris! Ensure data consistency and supercharge efficiency by seamlessly combining insert and update operations into one powerful action. Discover how Polaris’s...
 to go to the edit mode, where you can change dimensions, measures and general preferences.