Observability
Observability at Scale
Build better cloud applications with full visibility into the health and performance across the entire application.
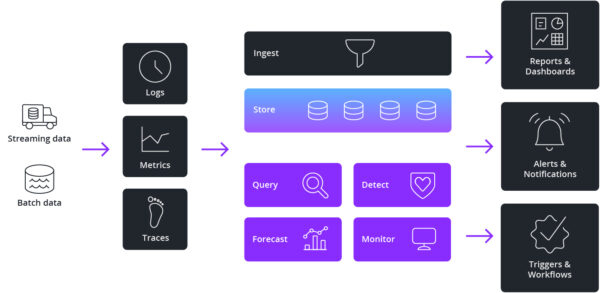
Observability allows teams to monitor modern systems more effectively and helps them to find and connect effects in a complex chain and trace them back to their cause. It gives system administrators, IT operations analysts, and developers visibility into their entire architecture. This allows them to drill into how different components of an application are performing, identify bottlenecks, and troubleshoot issues.
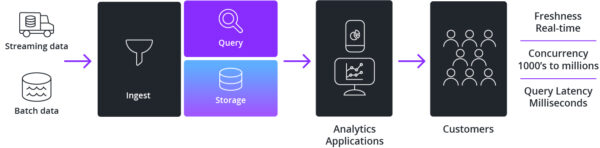
Building an observability app powered by a real-time analytics database provides the ability to handle high-cardinality metrics in high volume for fine-grained visibility across internet scale services.
Observability challenges
Answer ad-hoc questions across rapidly changing data at any scale
It’s impossible to anticipate all the questions (using predefined aggregations) with today’s internet scale services. With cardinality data, you are never facing the same repeatable issues over and over.
Access to both transactional histories as well as real-time data Immediate ingestion of real-time data so you can see what’s happening now while easily comparing it to historical data.
Debug only works if you can take one step quickly after the next It should return in subsecond query times because when you are debugging it is important not to break your state of flow.
Why use a real-time analytics database for observability
Operating Internet-scale services requires fine-grained visibility down to the individual user, tenant, or application behavior while also providing visibility across the entire application. Most traditional off-the-shelf monitoring options fail to scale or become very cost-prohibitive when used at scale.
When you’re building an analytics application for effective observability at any scale a real-time analytics database is critical for high volume and high data throughput. High cardinality metrics can be ingested in milliseconds, making them immediately available for monitoring analytics. This enables you to rapidly visualize and explore both real-time stream data and historical data with subsecond query response times.
Real-time analytics databases enable rapid analysis of application events with thousands of attributes and compute complex metrics on load, performance, and usage. For example, it’s easy to rank API endpoints based on 95th percentile query latency, then slice and dice how these metrics change based on any ad-hoc set of attributes such as time of day, user demographic, or datacenter location.
Success Story
To ensure a consistently great experience for more than 200 million members in more than 190 countries enjoying 250 million hours of TV shows and movies each day, Netflix built an observability analytics application powered by Apache Druid.
By turning log streams into real-time metrics, Netflix is able to see how over 300 million devices (across 4 major UIs) are performing at all times in the field. Netflix chose Apache Druid as their real-time analytics database to power their analytics application because it uniquely meets their high ingestion rate of data, high cardinality, and fast query requirements. By ingesting over 2 million events per second and executing subsecond queries over 1.5 trillion rows, Netflix engineers are able to pinpoint anomalies within their infrastructure, endpoint activity, and content flow.
![]()
Druid is our choice for anything where you need subsecond latency, any user interactive dashboarding, any reporting where you expect somebody on the other end to actually be waiting for a response. If you want super fast, low latency, less than a second, that’s when we recommend Druid.
Parth Brahmbhatt, Senior Software Engineer
Source:
To learn more
- Read Druid Architecture & Concepts
- Read this customer success eBook on Apache Druid
- Try the free trial of Imply Polaris, built from Apache Druid and delivered as a fully-managed DBaaS
- Contact Imply, founded by the original creators of Apache Druid, to request a demo or discuss how best to use Druid for your use case
User Behavior
Understanding User Behavior in Real-Time
Harness user activity data to optimize all aspects of the user experience as people interact with your web, mobile, and other applications.
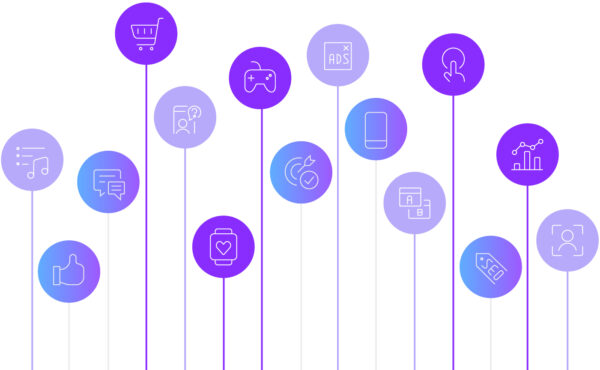
Businesses are now collecting, analyzing, and aggregating user activity data, known as behavioral data to gain insights like customer traffic analysis, marketing campaign effectiveness, market segmentation, sales funnel analysis, and more. Behavioral data includes direct interaction (such as website clicks and mobile app swipes), views, and related context, including page load time, loiter time, browser or device used by the visitor, and more.
Building an analytics application powered by a real-time analytics database for behavioral data is critical to analyze the product experience, understand user intent, and personalize the product experience for different customer segments.
User behavior analytics challenges
Answer ad-hoc questions across long sequence lengths with high cardinality
The number of unique events for a modern website can range from thousands to tens of thousands. It’s common for each session to generate hundreds of events.
Consume raw behavioral data quickly and efficiently
Data needs to be aggregated, filtered, and enriched. Raw events need to be filtered for bot-generated traffic. Handling such data at scale is extremely challenging.
Access to both transactional histories as well as real-time data
For several behavioral use cases, such as targeted personalization for a better user experience, the analysis must combine real-time activity with a historical understanding of the user’s past actions.
Why use a real-time analytics database for user behavior
Real-time analytics databases are designed for subsecond queries of complex data at high concurrency that combine real-time streams with historical data. Real-time analytics databases’ search capabilities and filter capabilities enable rapid, easy drill-downs of data along any set of attributes, enabling measurement and segmentation by age, gender, location, user preferences, purchasing patterns, and any other desired characteristics.
Off-the-shelf applications such as Google Analytics and Adobe SiteCatalyst help with clickstream analysis. However, these applications have scale limitations and lack access to raw data. As data sets quickly balloon to massive scale, developers need a database that enables their analysts to explore always-fresh data in real-time, feeding their curiosity and enabling proactive decision-making. They cannot act quickly and effectively with stale, pre-packaged data.
Real-time analytics databases may be used for funnel analysis, and to measure how many users took one action, but did not take another action. Analysis of the funnel is critical to learning from design decisions: how long did it take to get from the top to the bottom? What kinds of people abandoned their journey halfway through? When we made a change to page X, did it improve conversion rates from one step to the next?
Real-time analytics databases can be used to compute impressions, interactions, and key conversion metrics, filtered on publisher, campaign, user information, and dozens of other dimensions supporting full slice and dice capability.
Success Story
WalkMe is a Digital Adoption Platform pioneer that offers a 360-degree solution to leading organizations worldwide. WalkMe helps employees and customers at some of the world’s largest companies engage and adopt digital products, ensuring organizations of all sizes can undergo smooth digital transformations.
The legacy analytics system that was originally used to track core product usage was Elasticsearch, which was initially leveraged as a simple log management system. As WalkMe’s analyst’s queries evolved from simple troubleshooting queries to ones that measured complex engagement stats, these queries became less and less suited to the search-focused architecture of Elasticsearch.
![]()
Once we realized the legacy architecture was not well suited to behavioral analytics, and would not scale with our growth, we began searching for an alternative to transition our classic log search approach to a real-time analytics database that scales linearly with our traffic. Apache Druid met these criteria. Druid enables us to monitor performance across billions of client devices in real-time. We can leverage Druid to compute any arbitrary metrics over any ad-hoc groups of users. We can track business critical measures such as retention and attrition, plus many other forms of engagement and usage metrics. As a result, we can now gain the type of insight we need to optimize and segment our code for different host platforms, applications, and websites, per their specific needs.
Yotam Spenser, Head of Data Engineering
Source
- How WalkMe uses Druid and Imply Cloud to Analyze Clickstreams and User Behavior
To learn more
- Read Druid Architecture & Concepts
- Read this customer success eBook on Apache Druid
- Try the free trial of Imply Polaris, built from Apache Druid and delivered as a fully-managed DBaaS
- Contact Imply, founded by the original creators of Apache Druid, to request a demo or discuss how best to use Druid for your use case
Security & Fraud Analytics
Real-time Security and Fraud Analytics
Search, detect and investigate data in real-time to quickly find anomalies to prevent malicious attacks.
Security and fraud analytics is a proactive approach to cybersecurity that uses data collection, aggregation, and analysis capabilities to perform vital security functions that detect, analyze and mitigate cyber threats. Security and fraud analytic tools such as threat detection and security monitoring are deployed with the aim of identifying and investigating security incidents or potential threats such as external malware, targeted attacks, and malicious insiders. With the ability to detect these threats at early stages, security professionals have the opportunity to stop them before they infiltrate network infrastructure, compromise valuable data and assets, or otherwise cause harm to the organization.
Security and fraud analytic solutions aggregate data from numerous sources that include endpoint and user behavior data, business applications, operating system event logs, firewalls, routers, virus scanners, external threat intelligence, and contextual data, among other things. Combining and correlating this data gives organizations one primary data set to work with, allowing security professionals to apply appropriate algorithms and create rapid searches to identify early indicators of an attack. In addition, machine learning technologies can also be used to conduct threat and data analysis in near real-time.
For analyst teams to locate attacks, they need to be able to examine every area in the security landscape in real time. Security landscapes can comprise billions of endpoints, across hundreds of regions and hundreds to thousands of users. A single attack can span the entire digital landscape, leaving traces in network activity, hashes, log files, and connection requests, all of which are maintained in separate databases or datasets with vastly different schemas.
To keep detection from slipping from seconds to days, security analytics applications need to query events the moment that they occur. As each customer’s landscape is unique, getting data from a multitude of sources and formats into an effective platform for analysis can be onerous using traditional data engineering methods.
This is why developers are building modern analytics applications powered by real-time analytics databases for security and fraud analysis. These analytics apps use real-time analytics databases to collect and aggregate both real-time streams and historical batch data, monitor events continuously with subsecond responses, and provide the context required to distinguish true threats from false positives.
Security and Fraud Analytics Challenges
Answer ad-hoc questions across massive amounts of data
Security landscapes can comprise billions of endpoints, across hundreds of regions and hundreds to thousands of users.
Query real-time data on arrival to immediately detect threats
To keep detection from slipping from seconds to days, security applications need to query events continuously, with incoming events included immediately.
Protection that never sleeps with an always-on application
Threats don’t take vacations, and neither can security analytics. Databases designed for zero downtime (planned and unplanned) and zero data loss are critical.
Why use a real-time analytics database for security analytics?
Real-time analytics databases enable developers to build security analytics apps for analyst teams to examine every area in the security landscape in real time to locate attacks.
Security landscapes can comprise billions of endpoints, across hundreds of regions and hundreds to thousands of users. A single attack can span the entire digital landscape, leaving traces in network activity, hashes, log files, and connection requests.
To keep detection from slipping from seconds to days, real-time analytics databases enable security applications to query events the moment they occur. With real-time drill-down analytics capabilities, developers can build the right security app to close the gaps in threat detection and remediation.
Success Story
Sift prevents fraud with industry-leading technology and expertise and regularly deploys new machine learning models into production. Sift’s customers use the scores generated by machine learning models to decide whether to accept, block, or watch events and transactions. Since each customer has unique traffic and decision patterns, Sift needed a tool, which can automatically learn what “normal” looks like for each customer.
Sift built an automated monitoring tool, Watchtower, a system that would use anomaly detection algorithms to learn from past data and trigger alerts in real time on unusual changes. Watchtower is powered by Apache Druid, a real-time analytics database for interactive experiences with data. With Druid, they are able to aggregate data by a variety of dimensions from thousands of servers. They can then query this data across a moving time window with real-time analysis and visualization.
Sift is now able to proactively contact customers when anomalies are detected, preventing potential business impact for their customers.
![]()
“As the leader in Digital Trust & Safety, we enable online businesses to prevent fraud and abuse while streamlining customer experiences. We built an anomaly detection engine called Watchtower, which uses machine learning models to detect unusual activity. Apache Druid and Imply help us analyze data with an interactive experience that provides us with on-demand analysis and visualization.”
Neeraj Gupta, SVP of Engineering and Cloud Operations at Sift
Source
To learn more
- Read Druid Architecture & Concepts
- Read this customer success eBook on Apache Druid
- Try the free trial of Imply Polaris, built from Apache Druid and delivered as a fully-managed DBaaS
- Contact Imply, founded by the original creators of Apache Druid, to request a demo or discuss how best to use Druid for your use case
IoT & Telemetry
Bring IoT and Telemetry Data to Life
Analyze sensor data for a wide range of use cases including supply chain optimization, predictive maintenance, safety, and process efficiency management.
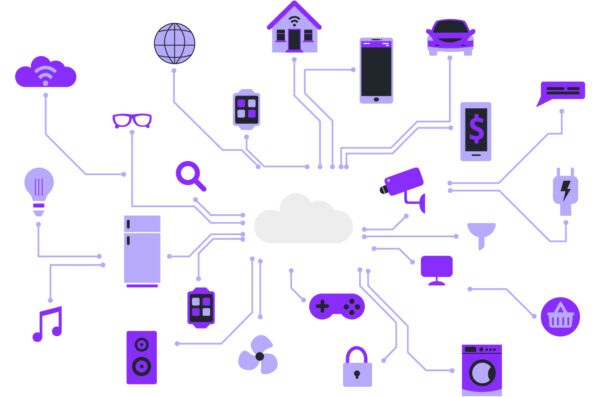
The Internet of Things (IoT) drives value across nearly every sector, spanning from manufacturing and logistics to retail and resource management. Data from a network of connected “things” that include drones, delivery trucks, medical devices, security cameras, construction equipment, thermostats, gaming consoles, and almost every other device that can be manufactured provides constant telemetry information on operating environments and metrics.
IoT sensors provide tons of valuable data. By understanding usage patterns, companies can predict shifts in customer behavior, design the next generation of products, automate routine tasks, and prevent issues before they occur. Unfortunately, harnessing IoT data is no easy task as they generate massive high-speed streams that are difficult to process, analyze, store, and secure. IoT data is also highly perishable, and without the right tools, organizations miss opportunities to act.
This is why developers are building modern analytics applications powered by real-time analytics databases. By extracting value from IoT sensors and systems in real time enables companies to create better products, services, and experiences.
IoT Analytics Challenges
Answer ad-hoc questions across massive amounts of time series data
IoT devices and sensors continuously generate massive quantities of data with a timestamp. Traditional databases are not designed to manage time series data as these databases input each data point separately, thereby creating a massive number of duplications.
Query real-time data on arrival as IoT is real-time by nature
With IoT, actions must be driven in seconds to less to be useful. This requires a database that enables high speed of ingestion combined with subsecond queries for low latency between when an event occurs and when it is available for query.
Protection that never sleeps with an always-on application
Sensor data is continuously being generated and IoT devices need to operate in real time. Look for a database designed for zero downtime (planned and unplanned) and zero data loss are critical.
Why use a real-time analytics database for IoT Analytics
Effective analytics for IoT and other telemetry data requires very high-speed ingestion of events, with immediate visibility of insights to the end user or automated process. Also required is ingesting data from databases and files to provide historical context and combining data from both sources with often complex queries.
Even when datasets grow to petabytes, IoT analytics needs high-performance, with consistent subsecond performance. High concurrency is also a requirement, as many dimensions and metrics need constant monitoring, so hundreds or thousands of queries need to execute simultaneously as well as both external and internal end user dimensions.
Downtime is not an option, so IoT analytics needs databases that are designed for zero planned downtime, self-healing clusters to avoid unplanned downtime, and durable storage to prevent data loss.
Success Story
Cisco ThousandEyes enables organizations to visualize any network as if it was their own, quickly surface actionable insights, and collaborate and solve problems with service providers.
They combine a variety of active and passive monitoring techniques to give their customers deep insight into user experience across applications and services delivered over the Internet. Monitoring the health of WAN network devices, such as wireless access points, routers, switches, firewalls, and load balancers, requires a tremendous amount of data that must be collected in real time.
To quickly analyze network device issues, ThousandEyes built an analytics application powered by Apache Druid to ingest and query large amounts of sensor data.
Druid powers ThousandEyes customer-facing dashboards that can be configured with many group bys, many filters, and visualize a lot of metrics. This enables ThousandEyes customers to interact with their data by asking questions in real time.
This replaced usage of MongoDB, which was not designed for analytics on their burgeoning amount of sensor data. When customers needed to visualize historical data over a period of days, dashboards were taking 15 minutes or longer to load, making it impossible to drill down into different metrics.
Now, with Druid behind their analytics app , ThousandEyes is able to keep up with their rising sensor data and deliver a consistently great and interactive experience to their customers by reducing dashboard latencies by 10x. This enables ThousandEyes customers to visualize their entire network topology across all their network devices to track down device interface issues in seconds and eliminate application-impacting device behaviors.
![]()
“To build our industry-leading solutions, we leverage the most advanced technologies, including Imply and Druid, which provides an interactive, highly scalable, and real-time analytics engine, helping us create differentiated offerings.”
Murtaza Doctor, Head of Engineering& Operations at Cisco ThousandEyes
To learn more
- Read Druid Architecture & Concepts
- Read this customer success eBook on Apache Druid
- Try the free trial of Imply Polaris, built from Apache Druid and delivered as a fully-managed DBaaS
- Contact Imply, founded by the original creators of Apache Druid, to request a demo or discuss how best to use Druid for your use case
External Analytics
Empower Your External Application Users
Empowering customers and partners with real-time operational and business insights.
More companies are giving their customers and partners insights as part of a value-added service or as a core product offering. These real-time insights are usually focused on the security, performance, billing, or usage of the customer environment. For example, in adtech, it’s critical to deliver instant and full transparency to advertisers on how users engage with their ads.
The crux of the capacity to deliver meaningful external analytics is the ability to support high concurrency. That’s because the best applications have the most active users and engaging experience. This leads to thousands or more users, each generating multiple queries as they interact with the data. Most traditional off-the-shelf options are built for internal usage but not for extending insights to customers and partners. They fail to scale or become very cost-prohibitive when used at scale.
It’s a challenge to use any database to build a customer-facing analytics application. There’s more on the line than internal use cases because now the analytics are part of the customer experience. Milliseconds of latency make a difference, downtime is costly, and concurrency and expenses can go through the roof. The last thing you want is frustrated customers because their applications are constantly getting hung up.
Only a database designed for real-time analytics can deliver subsecond queries, high concurrency, combined real-time & historic data, and high reliability at scale with reasonable cost.
Externally facing Analytics Challenges
Deliver an interactive data experience at scale
Create a dynamic experience and avoid long delays for users (i.e. the “spinning wheel of death”).
Build for today, future proof for tomorrow
Get the flexibility you need to continue to add new features to enhance your overall analytics experience without sacrificing interactivity. With the right foundation, you can go from simple queries to more complex ones to enable your customers to do more rapid drill-down exploration.
Power applications for any number of users
You don’t know how many of your customers and partners will be using the system at the same time. You need to be able to manage high concurrency without needing to build giant expensive clusters.
Deliver an always-on experience to drive revenue and ensure customer satisfaction
With competition a click away any disruption to your service is a direct hit on revenue. It’s why resiliency – both high availability (no downtime) and data durability (no data loss) – needs to be a top consideration.
Why use a real-time analytics database for externally facing analytics
Real-time analytics databases provide subsecond query performance at any scale, from gigabytes to multiple petabytes, a critical enabler for the interactive data conversations that customers and partners are seeking. They are explicitly designed for high concurrency, providing hundreds or thousands of concurrent queries, enabling every user to get the insights they want when they want them. They ingest real-time data from streams for immediate analysis and also ingest historic data from other databases and files, then allow the different data to be combined, empowering understanding of current events as they compare to events of the past.
Since downtime is not acceptable for external users, look for a real-time analytics database like Apache Druid that is self-healing and durable, with no planned outages for maintenance and the ability to keep running as hardware infrastructure fails.
Building an external analytics application powered by any generic OLAP database can be a challenge. Tradeoffs must be made to deliver an interactive experience at any scale (and avoid the spinning wheel of death). For example, precomputing all the queries makes the architecture very expensive and rigid. Limiting the data analyzed to only recent events doesn’t give your users the complete picture.
Success Story
To extend real-time insights to their advertisers, Pinterest chose Apache Druid to build Archmage, an externally-facing analytics application. This enables their advertisers to effectively reach over 400 million people who use Pinterest every month. This replaced usage of Apache Hbase, which was plagued with limitations and could not keep up with their growth. Once Pinterest hit millions of active users, they found it could take longer than 24 hours to give useful data to their advertisers.
With the help of Apache Druid’s real-time analytics database, Pinterest delivers instant and full transparency to advertisers on how users engage with their ads. Now, Pinterest is able to keep up with a rising active user base as well as add additional metrics and data-driven insights to help partners better connect with more relevant and meaningful ads.
Using Druid’s advanced capabilities, Pinterest added many new critical use cases including reporting partner and advertiser business metrics, organic pin stats, experiment metrics, spam metrics analysis, and more.
![]()
“As we had more and more advertisers each of them were requesting different slices and cuts of their data. Everybody wanted to see their metrics a little bit differently and [HBase] didn’t really support that. We said ‘what’s next for us?’ And we chose Apache Druid because it met all our key requirements.”
Filip Jaros, Software Engineer
To learn more
- Read Druid Architecture & Concepts
- Read this customer success eBook on Apache Druid
- Try the free trial of Imply Polaris, built from Apache Druid and delivered as a fully-managed DBaaS
- Contact Imply, founded by the original creators of Apache Druid, to request a demo or discuss how best to use Druid for your use case
Downlaod PDF – Key Use Cases and Sucess Stories of Real-Time Analytcis Databases