Who is knocking on our door? Analyzing AWS Netflows
Jun 27, 2018
Vadim Ogievetsky
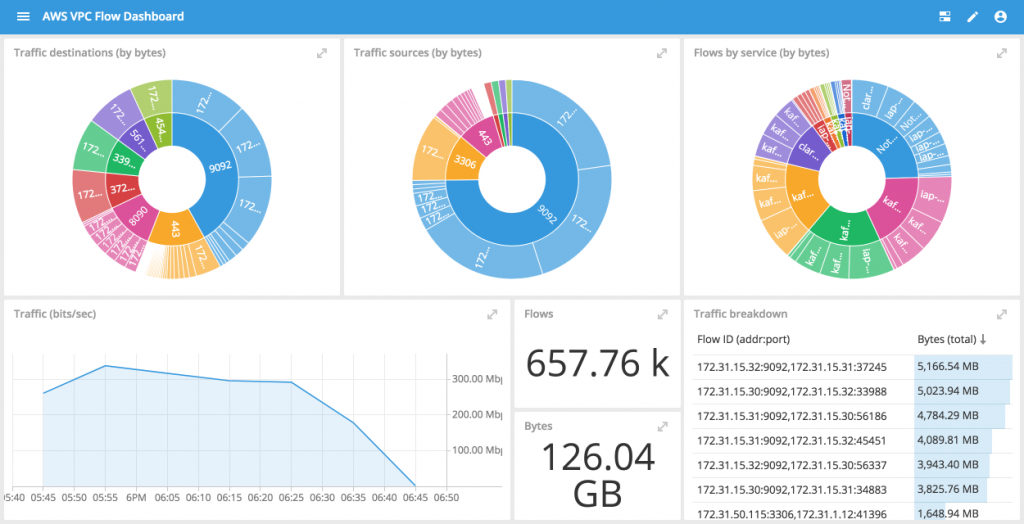
Operational analytics is a process to explain why patterns or trends occur in data.One use case for operational analytics is to analyze netflows to gain better understanding into network traffic.In the spirit of “eating your own dog food“, we started collecting netflows from our own Virtual Private Cloud (VPC) on AWS to see if there was any interesting traffic in our network.
Originally, we thought that this would make a couple of interesting dashboards for monitoring our traffic from various angles.
We certainly did not expect to find anything particularly surprising in the netflows themselves.However, the results of our analysis were surprising.
Exploring Rejected Netflows on AWS
When you have your data ingested in a powerful tool like Imply, digging through high volume data isn’t particularly challenging, and can lead to something surprising insights.
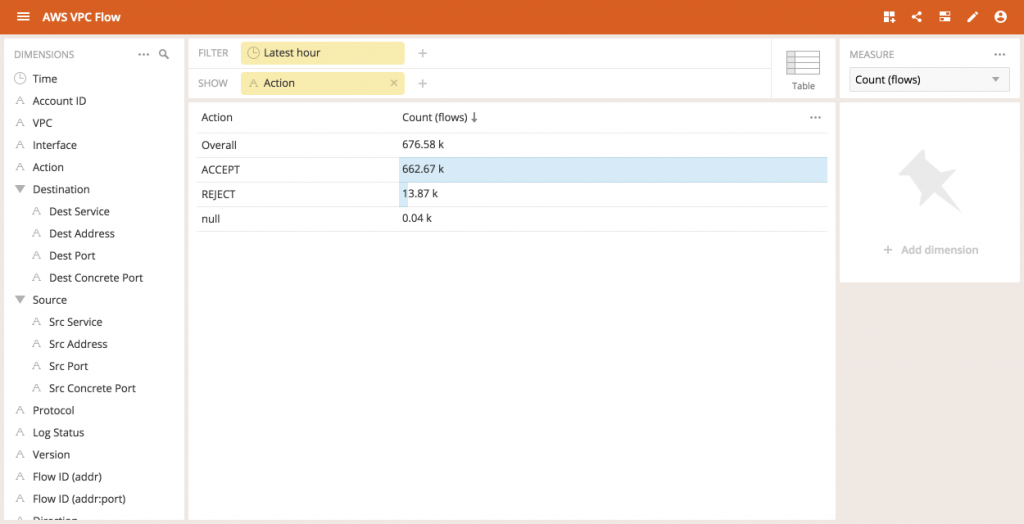
Looking at the data schema for our netflow data, we see that AWS provides an action attribute that is either ACCEPTED or REJECTED indicating whether the AWS security policies allowed the connection to happen or not.
All AWS instances have a public IP address.Even though the security policy blocks external connections on all ports, anyone can still try to connect to the IP address.It would just be recorded as a REJECTED flow.
By examining our live traffic, we see that there is a non-trivial number of rejected flows within the past hour (~2%)
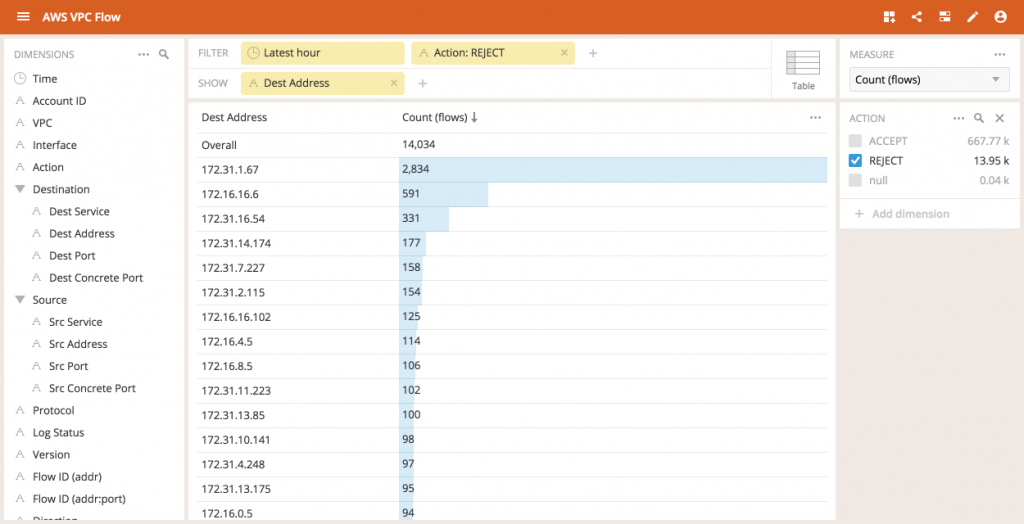
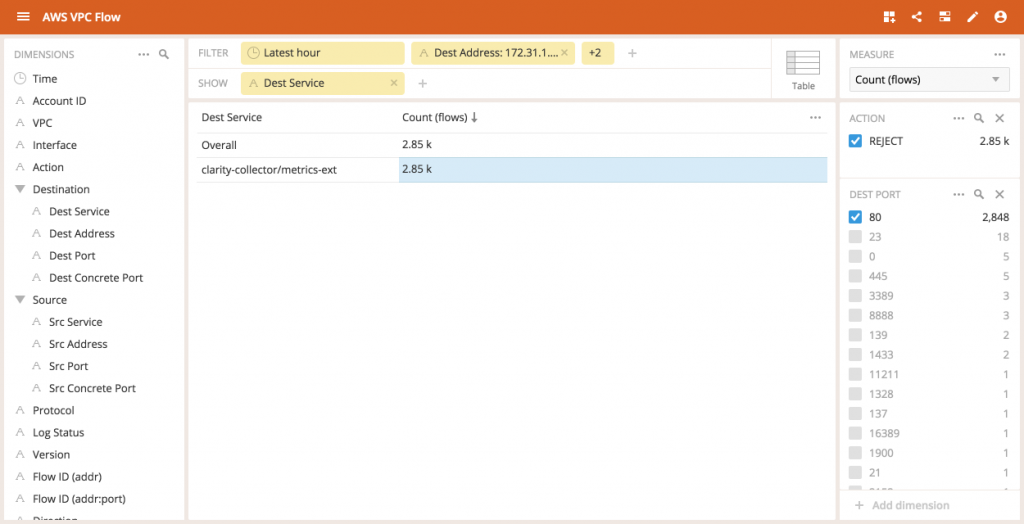
Zooming in on just the rejected flows, we can look at Dest Address to see which IP addresses (instances) are the targets of these attempted connections.
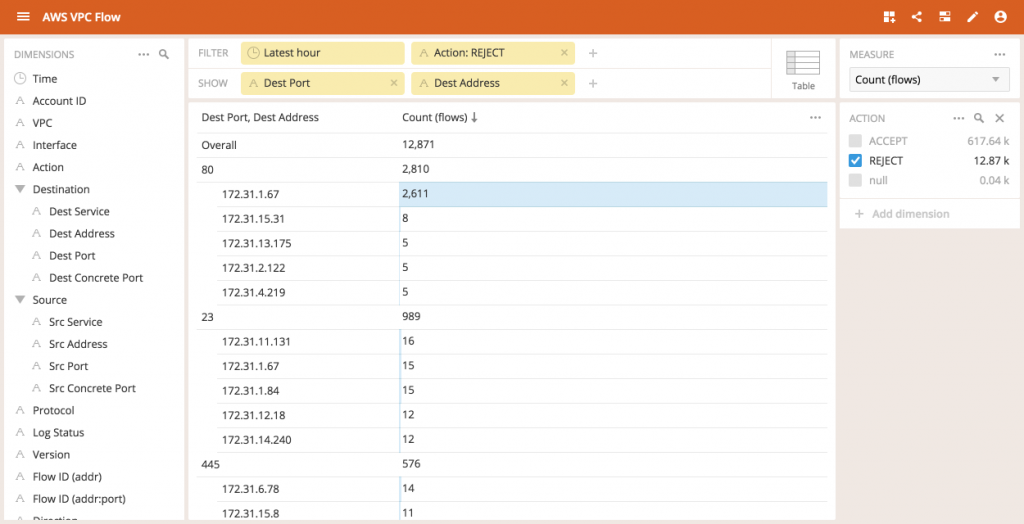
Interestingly, one IP address is experiencing more rejected connection attempts than the others.As we dig deeper by segmenting the data by Dest Port first, we can now see that a disproportionately large flows are happening from connections to the 172.31.1.67 address on port 80 (the default port for HTTP traffic).
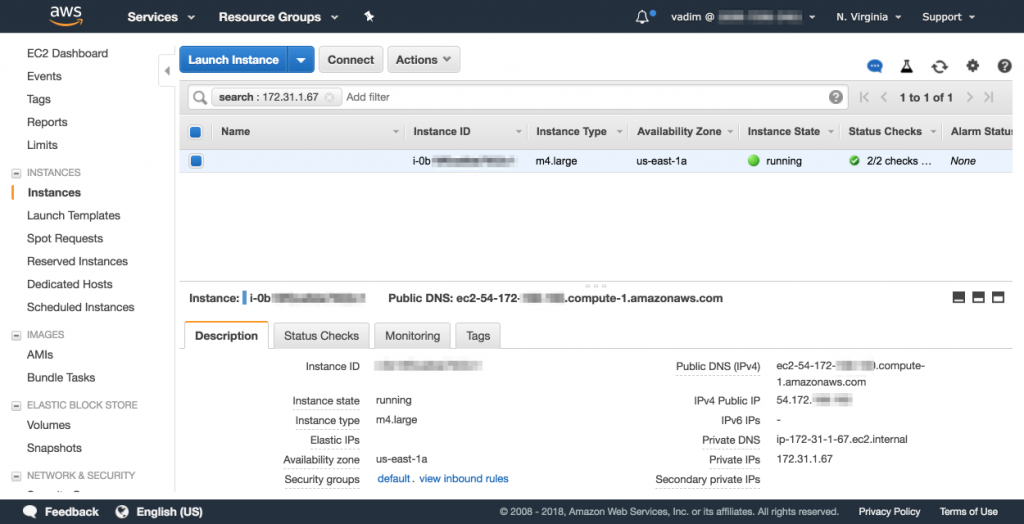
Of course, 172.31.1.67 is just the internal address of this machine, as that is what is being logged by the AWS flow service.The more relevant aspect is the external IP address associated with 172.31.1.67.
According to AWS, the external IP address starts with 54.172, and something is trying to connect to it.
Zooming in on this IP address and looking at what services are running on this instance we can see this it is a clarity-collector machine, a metrics collection machine for our Clarity Druid monitoring service.
This service should only be communicating with load balancers and an internal Kafka cluster. There is definitely no reason for anyone to try and connect to it directly.
Let’s see where these connections are coming from:
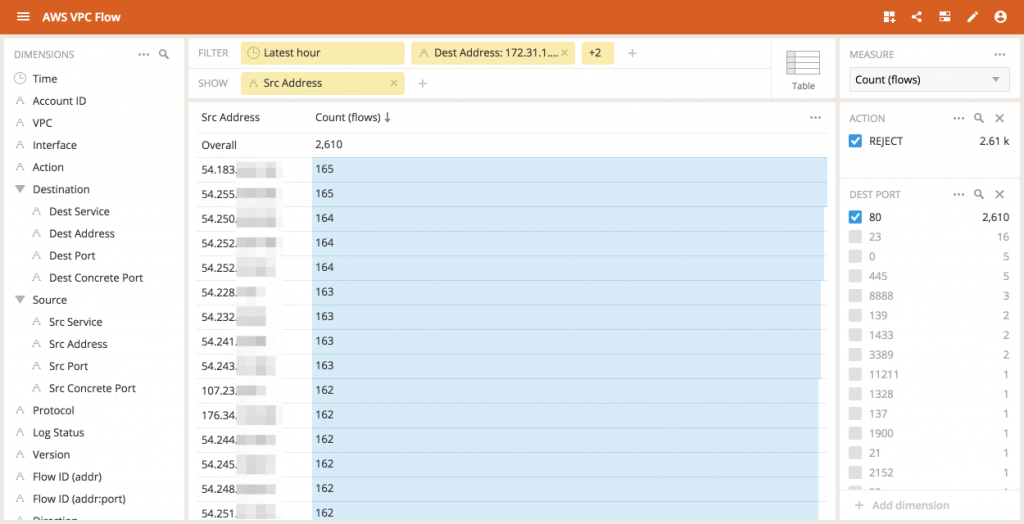
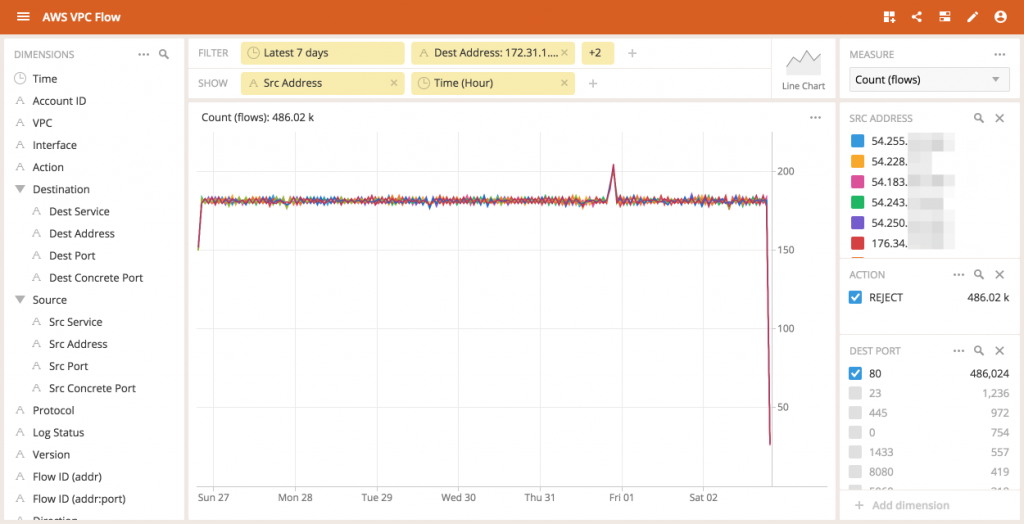
Showing the source address of all the netflows destined for this machine on port 80, we can see the IP addresses the flows are coming from. Immediately, we can see that this instance is being contacted by 16 IP addresses (one is not in the screenshot) and the number of connections each one attempts is very consistent for the hour.This feels automated.
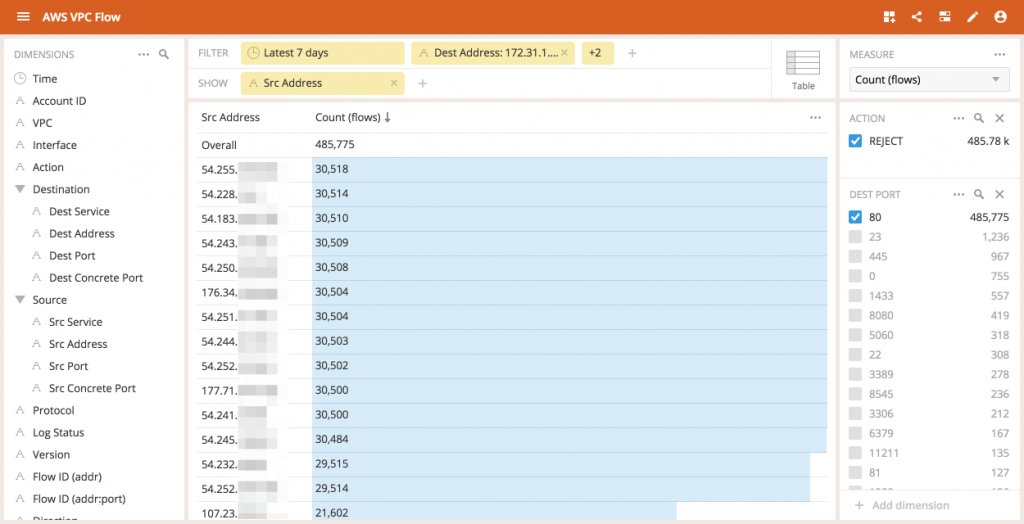
Expanding the timeline back to the last 7 days we see that these IP addresses are initiating connections at remarkably similar rates You have to admire the consistency.
Looking at the connection to this service over time we see that the same addresses were initiating connections at a very consistent rate of between 180 and 184 connections per hour or about a connection every 20 seconds(this is most likely some timeout) from each address.
In fact looking at an even larger slice of time we can see that this has been happening for as long as we have been collecting these netflows.
The most likely explanation is that the public address of this service used to belong to someone and ran some other service.Our IP address were probably hardcoded in a config file (or DNS record).Later, when the original owner of the address terminated the instance, the address was recycled (due to the scarcity of IPv4 addresses) and assigned to one of our instances.But, the services haven’t updated the IP address they should be connecting to.They are almost like “zombie” processes, where they are trying to connect to a service that is no longer there, but they will continue to attempt the connection.
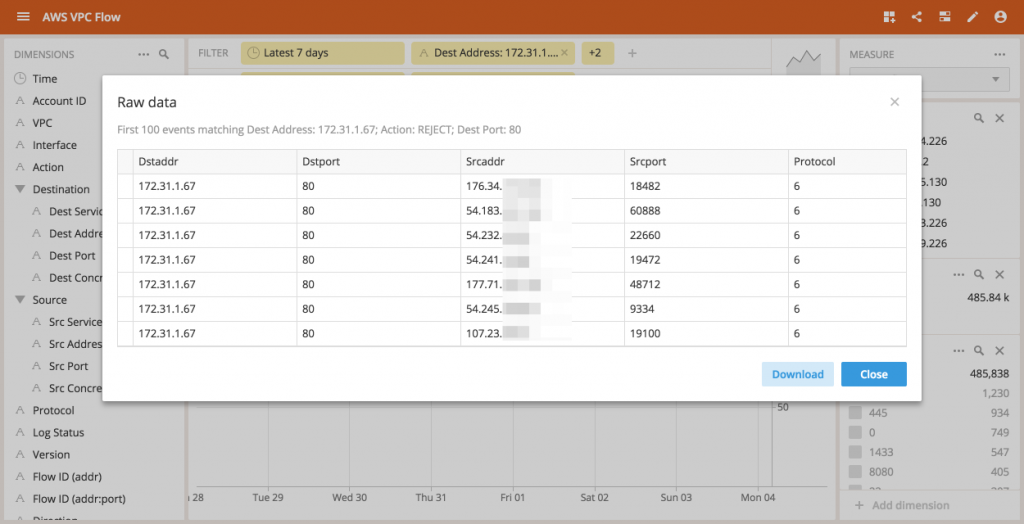
At this point we could look at the raw (un-aggregated) data emitted for these flows, but this is as far as the AWS reported netflow data will take us Since these flows are instantly rejected, there isn’t any other interesting metrics being logged.But, this is not the end of our journey.In the next chapter, we will relieve this machine of its Clarity duties and isolate it from the rest of the network.Then, we can start a server on port 80 and open it to the world to solve the mystery of the connections being made.
The ability to explain data patterns like in our netflows is what operational analytics is all about, and what we do here at Imply. If you are interested in this type of work, we are actively hiring.
Other blogs you might find interesting
No records found...
Jul 23, 2024
Streamlining Time Series Analysis with Imply Polaris
We are excited to share the latest enhancements in Imply Polaris, introducing time series analysis to revolutionize your analytics capabilities across vast amounts of data in real time.
Transform your data management with upserts in Imply Polaris! Ensure data consistency and supercharge efficiency by seamlessly combining insert and update operations into one powerful action. Discover how Polaris’s...