Imply Polaris is often referred to as the “easy button” for Apache Druid because it simplifies and streamlines the deployment, management, and utilization of Apache Druid. In this blog, we will cover how to use Imply Polaris to efficiently access data and convert it into meaningful insights.
Imply Polaris is a cloud-native DBaaS that simplifies the development, deployment, and management of real-time analytical applications. It is built on the foundation of Apache Druid, a high-performance, column-oriented, distributed data store designed for real-time analytics. Imply Polaris extends the capabilities of Apache Druid, making it easier to deploy, scale, and manage.
As a cloud-native, fully managed service, Imply Polaris offers several benefits over self-managed Apache Druid, including:
Reduced operational overhead: With Imply Polaris, you don’t need to worry about managing your own infrastructure or maintaining your Druid clusters. This can save you a significant amount of time and resources that would otherwise be spent on infrastructure management.
Elastic scaling: Imply Polaris offers elastic scaling that allows you to quickly and easily add or remove resources to meet changing demands. This can help you to reduce costs by scaling up or down as needed, without overprovisioning resources.
Easy data ingestion: Imply Polaris offers an intuitive, web-based UI for data ingestion that allows you to easily configure data sources and utilize pipelines. This can help you to quickly ingest and process large amounts of data, without needing to write custom scripts or code.
Advanced monitoring and alerting: Imply Polaris provides advanced monitoring and alerting features that allow you to track key metrics and receive notifications when anomalies occur. This can help you to identify issues and take corrective action before they impact your business.
Improved security: Imply Polaris includes advanced security features such as data encryption, access controls, and auditing. This can help you to secure your data and comply with regulatory requirements.
These benefits can enable users to dedicate their efforts toward data analysis and data-driven decision-making and other value-adding activities, without the need to focus on infrastructure management.
Imply Account Setup
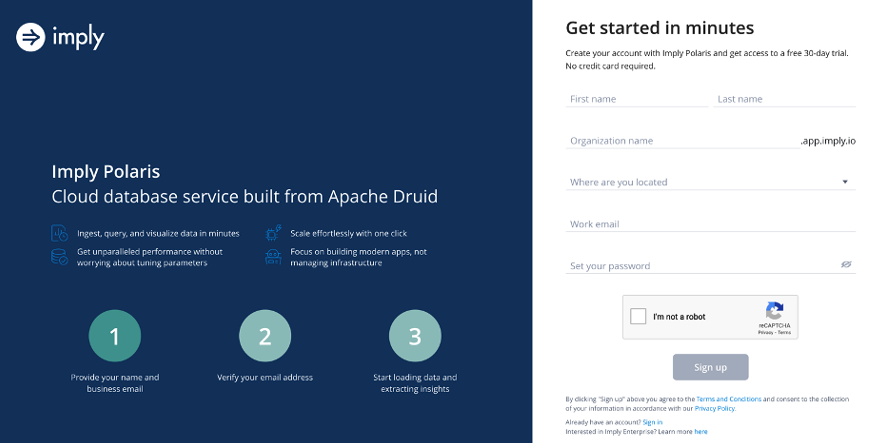
The first step is to visit the Imply Polaris website at imply.io. Once you’re there, click on the “Try Polaris for Free” button.
You will be taken to the sign-up page where you will be prompted to enter your email address and choose a password. Once you have filled in these details, click on the “Sign Up” button. See the screenshot below:
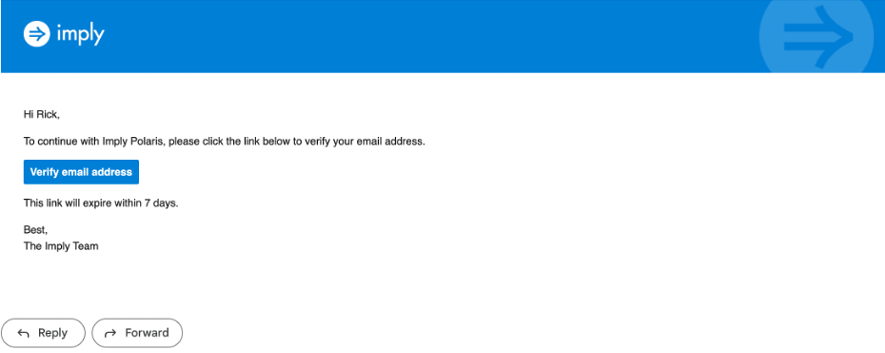
Imply Polaris will send you a verification email to confirm your account. Check your email inbox and click on the verification link to proceed. The email will be similar to the screenshot below.
Once you have verified your account, you will be asked to select a region and then select create. This will take a few minutes.
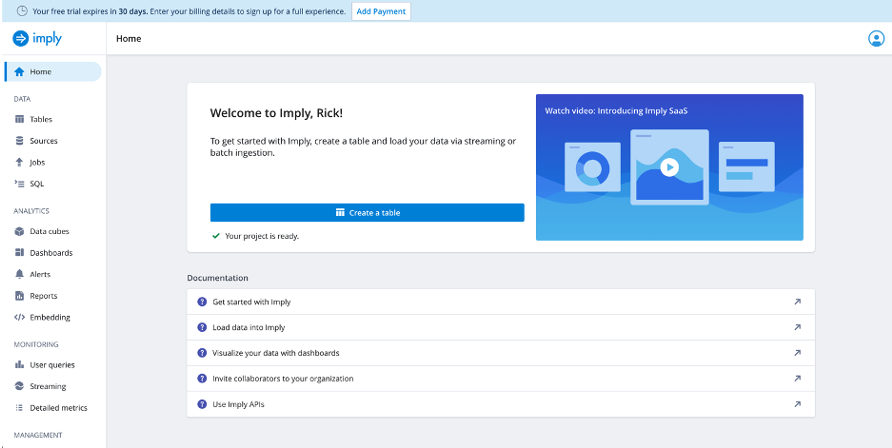
Then you will be taken to the Imply Polaris dashboard (see the screenshot below).
Here, you can start exploring the platform, setting up your data sources, creating jobs etc. Let’s first create a data source.
Create Data Source
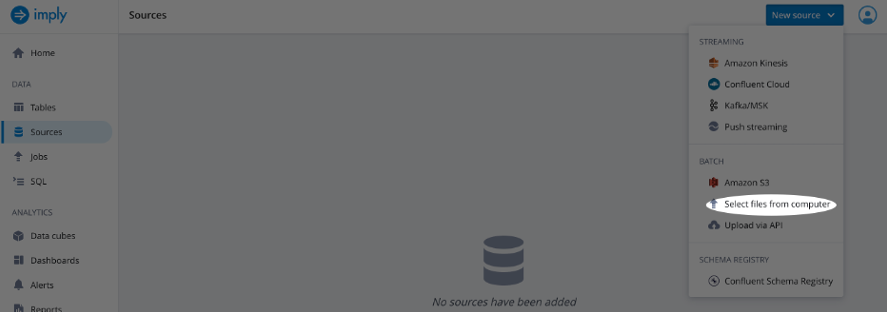
From the Imply UI select Sources
Select New source
Choose Select files from computer (see screenshot below)
For this exercise I choose the wikipedia.json.gz dataset which represents Wikipedia page edits for a given day can be downloadedhere:
Browse to the location of the file on your system and select Open.
Now that we have created a data source, let’s create a table to store that data.
Create Table
From the Imply UI select Tables
Select Create table and name the table wikipedia
Select Create
Now let’s load data.
Load Data
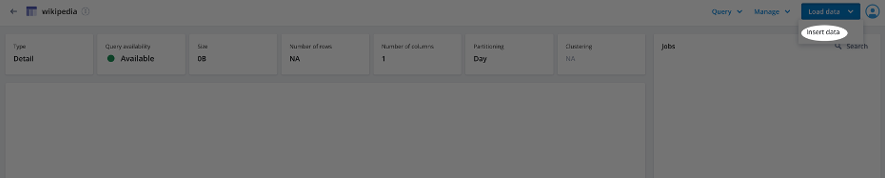
Select Load data and Insert data (see screenshot below).
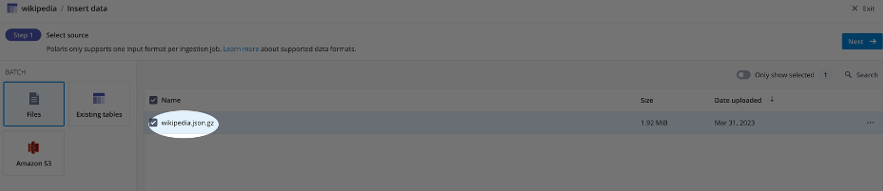
Select the source by choosing Files and selecting the file we added as a data source earlier (see screenshot below).
Select Next
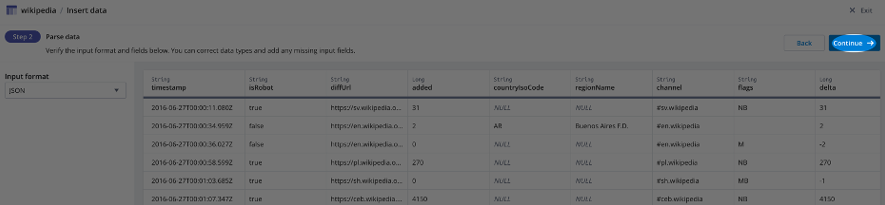
Choose JSON as the Input format and select Continue (see screenshot below).
Select Start ingestion
Note that Polaris selects the timestamp field automatically in this example. Timestamps are essential for several reasons including:
Time-based indexing: When data is ingested into Polaris, it is typically organized into segments based on a timestamp field, via rollups. These segments are then partitioned and indexed based on time, which allows for fast and efficient querying of the data based on when it was recorded.
Time-based queries: In order to make meaningful queries on time-series data, it’s essential to have a timestamp field that provides context about when the data was recorded. With a timestamp field, you can perform time-based queries that help you identify patterns and trends in your data over time. For example, you can filter data based on a specific time range or aggregate data based on time intervals (e.g., hourly, daily, or weekly).
Time-based calculations: A timestamp field can also be used to perform time-based calculations and aggregations. For example, you can calculate the average, sum, or count of other fields within each time interval. This can help you identify trends and patterns in your data, and can be particularly useful when creating visualizations or reports that highlight these trends.
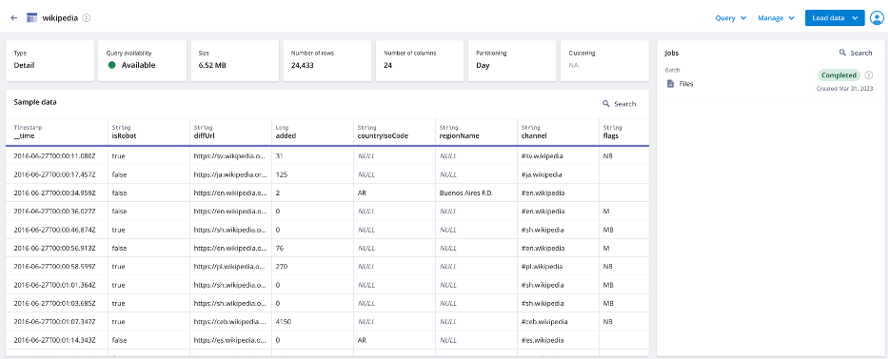
Once the job is completed, the UI will show a sample of the ingested data (see screenshot below).
Now that we have uploaded data, let’s run some queries.
Querying Data
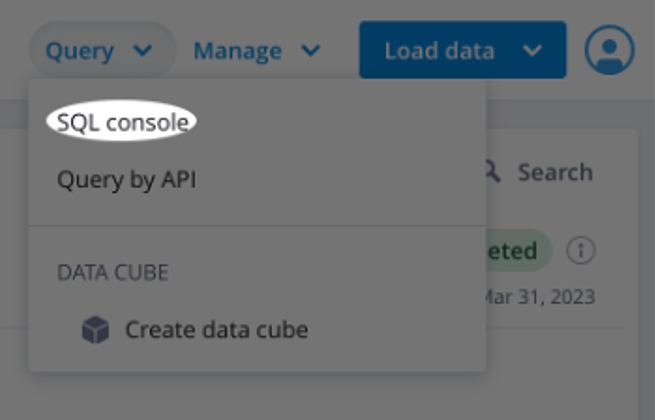
After loading data, select Query from the header and choose SQL console (see screenshot below).
Query 1
The query below will group the data by the hour of the timestamp in the __time column, and count the number of records in each group which represents the edits per hour. The ORDER BY clause sorts the results in ascending order based on the hour alias we created in the SELECT clause.
The query below is counting the number of edits made by each robot user in the Wikipedia dataset, and sorts the results in descending order based on the number of edits, limited by 10 to get the top 10 users.
It is a best practice to filter by TIMESTAMP. Not doing so runs the risk of returning an overwhelming amount of data and poor query performance. Similar to a SELECT * with no LIMIT in a relational database.
The query below selects the __time column from the wikipedia table and rounds the timestamp down to the nearest hour using the FLOOR function. It then groups the data by hour for a specific time range between June 27th, at 2:00 PM and 5:00 PM, allowing for analysis and visualization of Wikipedia data trends over time.
SELECTFLOOR(__time toHOUR) AS HourTime, COUNT(*) AS"Edits"FROM wikipedia WHERE"__time"BETWEENTIMESTAMP'2016-06-27 14:00:00.000'ANDTIMESTAMP'2016-06-27 16:00:00.000'GROUP BY1
Query 4
The query below selects the __time column from the wikipedia table and rounds the timestamp down to the nearest hour using the FLOOR function. It then groups the data by hour and user, counting the number of edits made by each human user during a specified time range between June 27th, 2016 at 2:00 PM and June 27th, 2016 at 4:00 PM. The results are sorted in descending order based on the number of edits, and limited to the top 10 users with the highest number of edits.
This query calculates the average number of distinct pages edited by human users in each minute, based on data from the Wikipedia table. The subquery filters out rows where the isRobot column is ‘false’’ and groups the data by user, page, and minute, then calculates the count of distinct pages edited by each user per minute. The outer query then selects the human_user, page, __time_minute, and average num_distinct_pages_edited for each minute, human user, and page combination.
SELECT t.human_user, t.page, t.__time_minute,AVG(t.num_distinct_pages_edited) AS avg_distinct_pages_editedFROM(SELECT user AS human_user,page, DATE_TRUNC('minute', __time) AS __time_minute,COUNT(*) AS num_distinct_pages_editedFROM wikipediaWHERE isRobot ='false'GROUP BY1, 2, 3HAVINGCOUNT(*) >=2) AS tGROUP BY1, 2, 3
Visualization in Polaris
Polaris includes a web-based data visualization tool that allows you to explore and analyze large data sets. Let’s create some visualizations by first building a cube.
Create Cube
Cubes are a representation of multi-dimensional data. They are a way to organize and analyze data across various dimensions (e.g., time, location, product, etc.) and measures (e.g., revenue, sales, etc.). Polaris leverages cubes to allow users to explore and visualize data interactively, by slicing and dicing the data along different dimensions. Users can easily drill down, filter, and pivot the data to gain insights and make data-driven decisions.
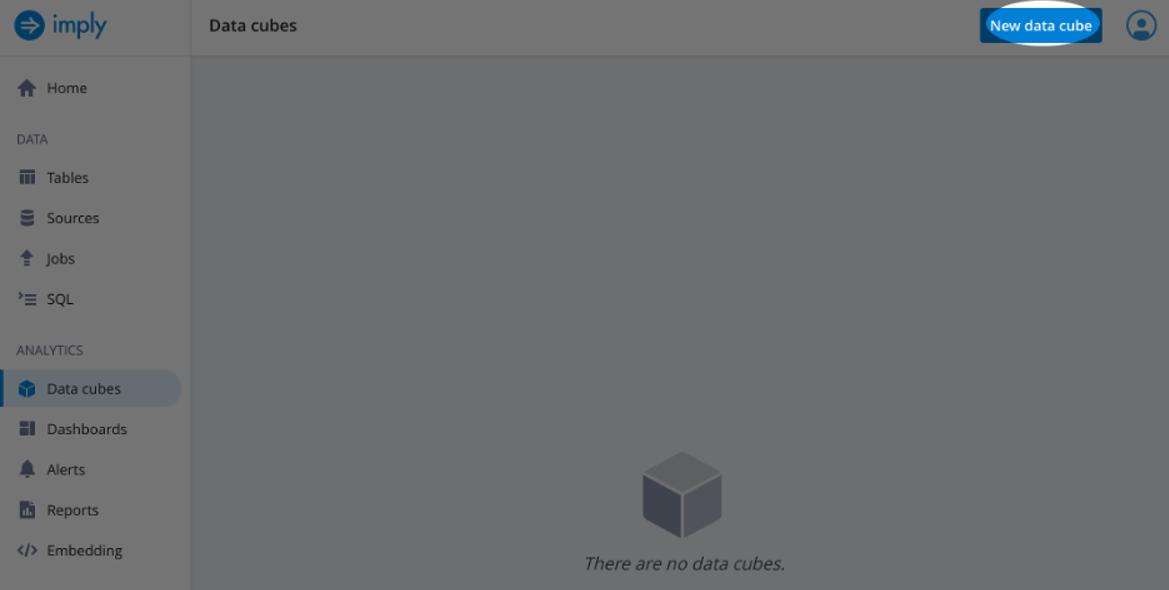
To create a cube select Data cubes under the Analytics tab on the left side of the screen and then select New data cube (see screenshot below).
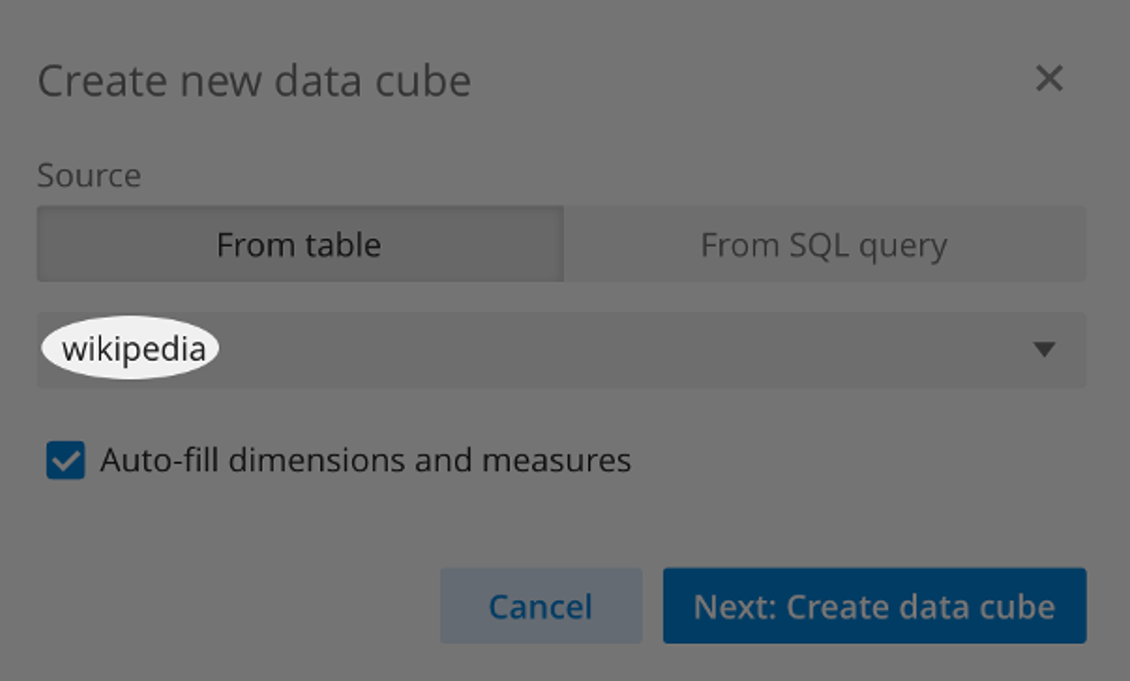
From the pop-up wizard, select Source as From Table and select the wikipedia data source we created earlier. Then select Next: Create data cube (see screenshot below).
Next, Save the cube with the selected properties.
Create Visualizations
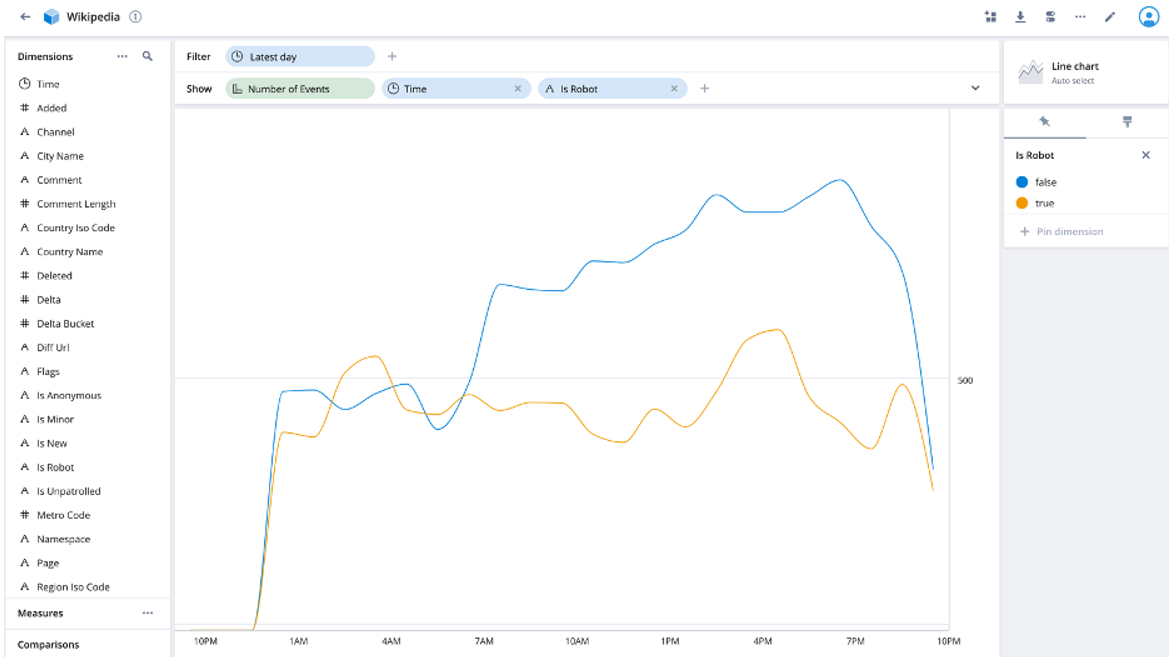
The following screen should have a preselected Filter of Latest day with Number of Events in the Show field.
In the Show row click the + button and Time and is Robot fields.
The resulting table shows number of events over time where the entries are Is Robot versus not for the latest day’s data (see screenshot below).
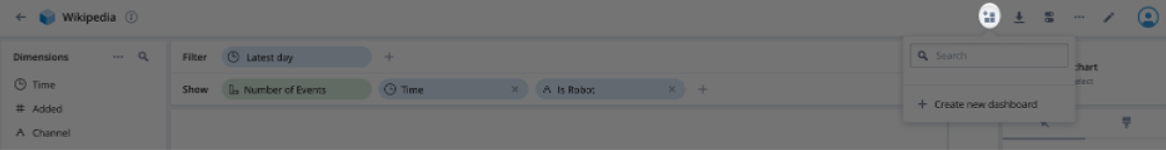
Now add this visualization to a dashboard using the first button on the top right of the UI (see screenshot below).
Select the + Create new dashboard option and name the dashboard example_dashboard.
Now Select the Create button.
Let’s add two more visualizations.
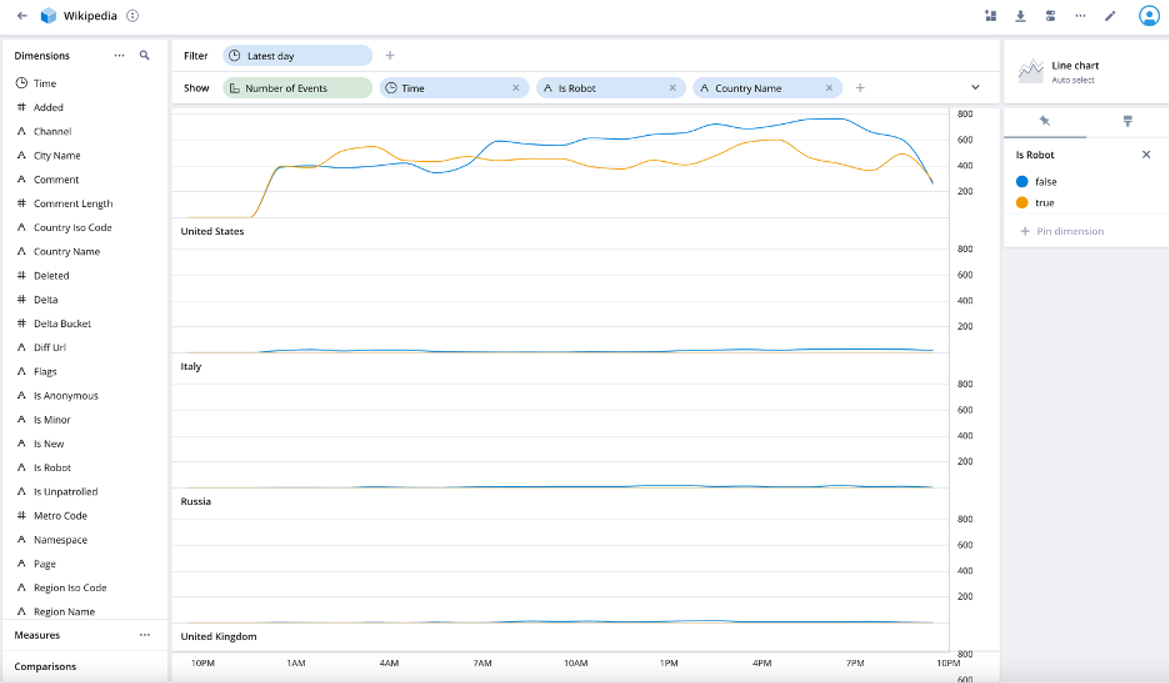
From the visualization, edit screen add Country Name. This gives us the events over time by robots compared to humans for each country (see screenshot below).
Add this visualization to the dashboard and save the updated dashboard
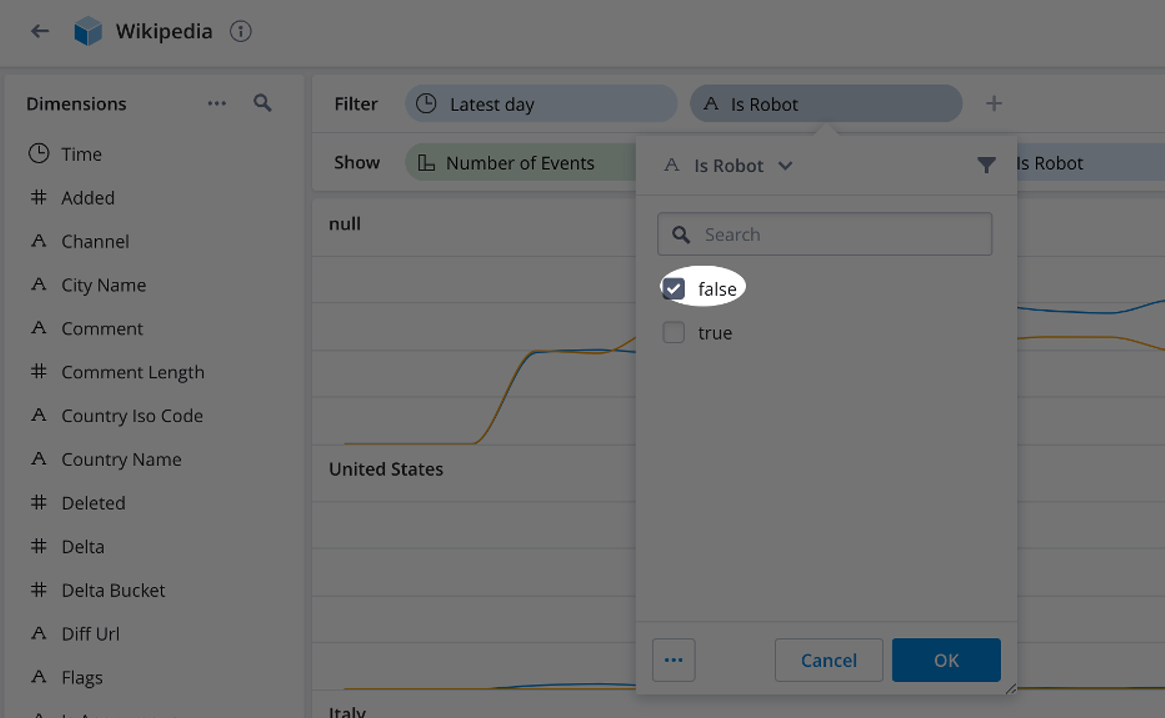
Finally, let’s filter for only human entries. Drag Is Robot from the Show row to the Filter row and select false (see screenshot below).
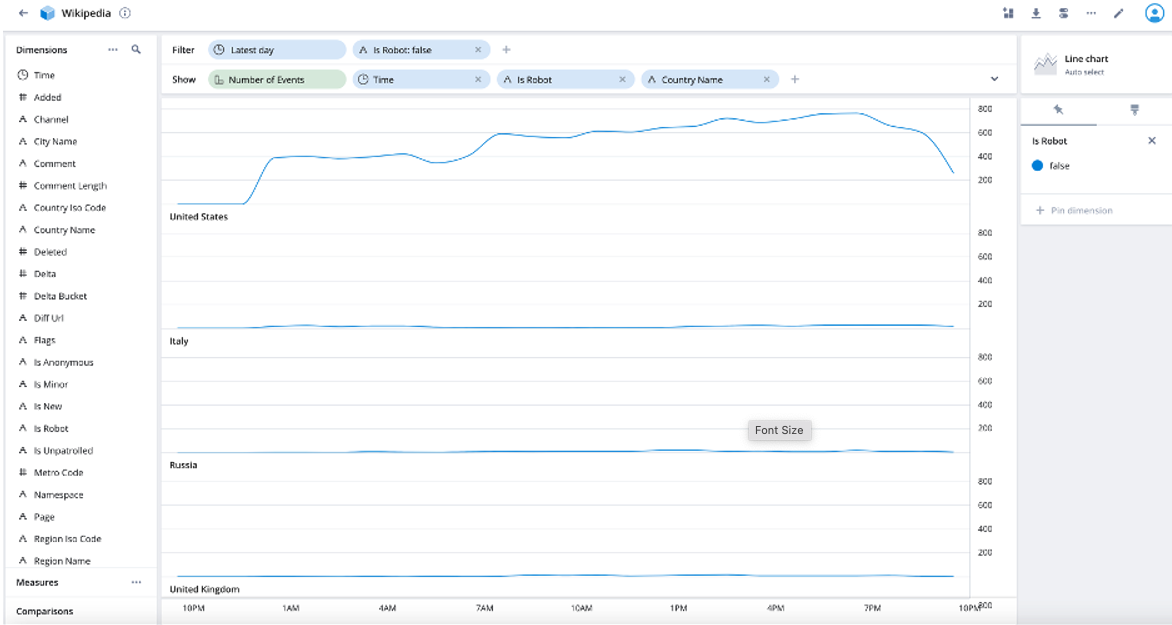
The resulting visualization shows human entries by country over a one-day time span (see screenshot below).
Add this visualization to the dashboard and save the updated dashboard.
These charts are dynamic and update when the data changes. So, if the visualization had a dynamic data source, the charts we created would update in real-time. Polaris visualizations can also be embedded into their applications which saves development time and efforts.
Summary
To summarize, Imply Polaris serves as an invaluable tool for businesses seeking to tap into the potential of real-time analytics with Apache Druid. Its easy deployment, simplified management, and powerful visualization capabilities make it an ideal solution for organizations aiming to analyze large volumes of data and extract meaningful insights. Some of the advantages of using Imply Polaris over a self-managed Apache Druid deployment are reduced operational overhead, elastic scaling, monitoring and alerting, and a visualization service. By leveraging Imply Polaris, users can implement real-time analytic solutions to help make more informed decisions and drive business success.
In this blog post, we have explored many of the capabilities of Imply Polaris. We began by setting up an Imply Polaris account and creating a data source. We then proceeded to create a table, load data and run various queries to analyze the data. Next, we delved into the data visualization capabilities that enable users to quickly explore and analyze large datasets. We created a cube, which represents multi-dimensional data, and built several visualizations to showcase the ease and flexibility of Polaris. The dynamic nature of these visualizations ensures that they automatically update as the underlying data changes, making them ideal for real-time analytics.
Stay tuned to this medium for more helpful information highlighting the features that make Imply Polaris the best database for storing, analyzing and visualizing your data.
About the Author
Rick Jacobs is a Senior Technical Product Marketing Manager at Imply. His varied background includes experience at IBM, Cloudera, and Couchbase. He has over 20 years of technology experience garnered from serving in development, consulting, data science, sales engineering, and other roles. He holds several academic degrees including an MS in Computational Science from George Mason University. When not working on technology, Rick is trying to learn Spanish and pursuing his dream of becoming a beach bum.
Other blogs you might find interesting
No records found...
Jun 06, 2023
Introducing hands-on developer tutorials for Apache Druid
The objective of this blog is to introduce the new set of interactive tutorials focused on the Druid API fundamentals. These tutorials are available as Jupyter Notebooks and can be downloaded as a Docker container.
In this blog article I’ll unpack schema auto-discovery, a new feature now available in Druid 26.0, that enables Druid to automatically discover data fields and data types and update tables to match changing...
Apache Druid® 26.0, an open-source distributed database for real-time analytics, has seen significant improvements with 411 new commits, a 40% increase from version 25.0. The expanded contributor base of 60...
Should You Build or Buy Security Analytics for SecOps?
When should you build—or buy—a security analytics platform for your environment? Here are some common considerations—and how Apache Druid is the ideal foundation for any in-house security solution.
Druid now has a new function, Unnest. Unnest explodes an array into individual elements. This blog contains design methodology and examples for this new Unnest function both from native and SQL binding perspectives.
What’s new in Imply Polaris – Our Real-Time Analytics DBaaS
Every week we add new features and capabilities to Imply Polaris. This month, we’ve expanded security capabilities, added new query functionality, and made it easier to monitor your service with your preferred...
How to Build a Sentiment Analysis Application with ChatGPT and Druid
Leveraging ChatGPT for sentiment analysis, when combined with Apache Druid, offers results from large data volumes. This integration is easily achievable, revealing valuable insights and trends for businesses...
In this blog, we will compare Snowflake and Druid. It is important to note that reporting data warehouses and real-time analytics databases are different domains. Choosing the right tool for your specific requirements...
Learn how to achieve sub-second responses with Apache Druid
Learn how to achieve sub-second responses with Apache Druid. This article is an in-depth look at how Druid resolves queries and describes data modeling techniques that improve performance.
Apache Druid uses load rules to manage the ageing of segments from one historical tier to another and finally to purge old segments from the cluster. In this article, we’ll show what happens when you make...
Real-Time Analytics: Building Blocks and Architecture
This blog identifies the key technical considerations for real-time analytics. It answers what is the right data architecture and why. It spotlights the technologies used at Confluent, Reddit, Target and 1000s...
What’s new in Imply Polaris – Our Real-Time Analytics DBaaS
This blog explains some of the new features, functionality and connectivity added to Imply Polaris over the last two months. We've expanded ingestion capabilities, simplified operations and increased reliability...
Wow, that was easy – Up and running with Apache Druid
The objective of this blog is to provide a step-by-step guide on setting up Druid locally, including the use of SQL ingestion for importing data and executing analytical queries.
Tales at Scale Podcast Kicks off with the Apache Druid Origin Story
Tales at Scale cracks open the world of analytics projects and shares stories from developers and engineers who are building analytics applications or working within the real-time data space. One of the key...
Real-time Analytics Database uses partitioning and pruning to achieve its legendary performance
Apache Druid uses partitioning (splitting data) and pruning (selecting subset of data) to achieve its legendary performance. Learn how to use the CLUSTERED BY clause during ingestion for performance and high...
Easily embed analytics into your own apps with Imply’s DBaaS
This blog explains how developers can leverage Imply Polaris to embed robust visualization options directly into their own applications without them having to build a UI. This is super important because consuming...
Building an Event Analytics Pipeline with Confluent Cloud and Imply’s real time DBaaS, Polaris
Learn how to set up a pipeline that generates a simulated clickstream event stream and sends it to Confluent Cloud, processes the raw clickstream data using managed ksqlDB in Confluent Cloud, delivers the processed...
We are excited to announce the availability of Imply Polaris in Europe, specifically in AWS eu-central-1 region based in Frankfurt. Since its launch in March 2022, Imply Polaris, the fully managed Database-as-a-Service...
This is a what's new to Imply in Dec 2022. We’ve added two new features to Imply Polaris to make it easier for your end users to take advantage of real-time insights.
Combating financial fraud and money laundering at scale with Apache Druid
Learn how Apache Druid enables financial services firms and FinTech companies to get immediate insights from petabytes-plus data volumes for anti-fraud and anti-money laundering compliance.
Imply Pivot delivers the final mile for modern analytics applications
This blog is focused on how Imply Pivot delivers the final mile for building an anlaytics app. It showcases two customer examples - Twitch and ironsource.
For decades, analytics has been defined by the standard reporting and BI workflow, supported by the data warehouse. Now, 1000s of companies are realizing an expansion of analytics beyond reporting, which requires...
Apache Druid is at the heart of Imply. We’re an open source business, and that’s why we’re committed to making Druid the best open source database for modern analytics applications
Tales at Scale Podcast: Who Really Needs Real-Time Data?
Gwen Shapira, co-founder and CPO of Nile joins us to help define real-time data, discuss who needs it (and who probably doesn't) and how to not build yourself into a corner with your architecture. When you're...
When it comes to modern data analytics applications, speed is of the utmost importance. In this blog we discuss two approximation algorithms which can be used to greatly enhance speed with only a slight reduction...
The next chapter for Imply Polaris: celebrating 250+ accounts, continued innovation
Today we announced the next iteration of Imply Polaris, the fully managed Database-as-a-Service that helps you build modern analytics applications faster, cheaper, and with less effort. Since its launch in...
We obviously talk a lot about #ApacheDruid on here. But what are folks actually building with Druid? What is a modern analytics application, exactly? Let's find out
Elasticity is important, but beware the database that can only save you money when your application is not in use. The best solution will have excellent price-performance under all conditions.
Druid 0.23 – Features And Capabilities For Advanced Scenarios
Many of Druid’s improvements focus on building a solid foundation, including making the system more stable, easier to use, faster to scale, and better integrated with the rest of the data ecosystem. But for...
Apache Druid 0.23.0 contains over 450 updates, including new features, major performance enhancements, bug fixes, and major documentation improvements.
Imply Polaris is a fully managed database-as-a-service for building realtime analytics applications. John is the tech lead for the Polaris UI, known internally as the Unified App. It began with a profound question:...
There is a new category within data analytics emerging which is not centered in the world of reports and dashboards (the purview of data analysts and data scientists), but instead centered in the world of applications...
We are in the early stages of a stream revolution, as developers build modern transactional and analytic applications that use real-time data continuously delivered.
Developers and architects must look beyond query performance to understand the operational realities of growing and managing a high performance database and if it will consume their valuable time.
Building high performance logging analytics with Polaris and Logstash
When you think of querying with Apache Druid, you probably imagine queries over massive data sets that run in less than a second. This blog is about some of the things we did as a team to discover the user...
Horizontal scaling is the key to performance at scale, which is why every database claims this. You should investigate, though, to see how much effort it takes, especially compared to Apache Druid.
When you think of querying with Apache Druid, you probably imagine queries over massive data sets that run in less than a second. This blog is about some of the things we did as a team to discover the user...
Building Analytics for External Users is a Whole Different Animal
Analytics aren’t just for internal stakeholders anymore. If you’re building an analytics application for customers, then you’re probably wondering…what’s the right database backend?
After over 30 years of working with data analytics, we’ve been witness (and sometimes participant) to three major shifts in how we find insights from data - and now we’re looking at the fourth.
Every year industry pundits predict data and analytics becoming more valuable the following year. But this doesn’t take a crystal ball to predict. There’s instead something much more interesting happening...
Today, I'm prepared to share our progress on this effort and some of our plans for the future. But before diving further into that, let's take a closer look at how Druid's core query engine executes queries,...
Product Update: SSO, Cluster level authorization, OAuth 2.0 and more security features
When you think of querying with Apache Druid, you probably imagine queries over massive data sets that run in less than a second. This blog is about some of the things we did as a team to discover the user...
Druid Nails Cost Efficiency Challenge Against ClickHouse & Rockset
To make a long story short, we were pleased to confirm that Druid is 2 times faster than ClickHouse and 8 times faster than Rockset with fewer hardware resources!.
Unveiling Project Shapeshift Nov. 9th at Druid Summit 2021
There is a new category within data analytics emerging which is not centered in the world of reports and dashboards (the purview of data analysts and data scientists), but instead centered in the world of applications...
How we made long-running queries work in Apache Druid
When you think of querying with Apache Druid, you probably imagine queries over massive data sets that run in less than a second. This blog is about some of the things we did as a team to discover the user...
Uneven traffic flow in streaming pipelines is a common problem. Providing the right level of resources to keep up with spikes in demand is a requirement in order to deliver timely analytics.
Community Discoveries: multi-value dimensions in Apache Druid
Hellmar Becker is an Imply solutions engineer based in Germany, where he has been delving into the nooks-and-crannies of multi-valued dimension support in Druid. In this interview, Hellmar explains why...
Community Spotlight: Apache Pulsar and Apache Druid get close…
The community team at Imply spoke with an Apache Pulsar community member, Giannis Polyzos, about how collaboration between open source communities generates great things, and more specifically, about how...
Meet the team: Abhishek Agarwal, engineering lead in India
Abhishek is Imply’s first engineer in India. We spoke to him about setting up our operations in Bangalore and asked what kind of local talent the company is looking for.
Jihoon Son is a software engineer at Imply who works on Apache Druid®. He explains what drew him to Imply five years ago and why he’s even more inspired by the company today.
Community Spotlight: Sparking that connection with Apache Druid
It’s been nearly 10 years now since Druid was open sourced “to help other organizations solve their real-time data analysis and processing needs”. This has happened not because of one person or one...
Community Spotlight: Augmented analytics on business metrics by Cuebook with Apache Druid®
Cuebook is putting you, decision-maker, back in the driving seat, powered by Apache Druid®. In this interview with their founder and CEO, we learn their reason for being, their open source Cuelake tooling,...
Empowering all types of users to analyze data incredibly quickly from wherever it sits provides huge value to organizations. Citizen data scientists and decision scientists are able to make empirically-backed,...
Our vision at Imply has always been to create a new category for data analytics, analytics-in-motion, and enable organizations to unlock workflows they’ve never been able to do before. With the most recent...
Community Spotlight: Avesta powers next-generation applications with Apache Druid
When considering various real-time analytics solutions, Apache Druid quickly became the clear choice: Avesta uses only open-source products and libraries. And today, they’re using Druid as a central component...
The traditional BI workflow starts with a strategic question. Such a question is not too time-sensitive—days or weeks is okay—and the question is pretty complex to answer.
How we enabled the “Go Fast” button on TopN queries: Hint: we used vectorized virtual columns (which is new in Apache Druid 0.20.0)
Apache Druid is a fast, modern analytics database designed for workflows where fast, ad-hoc analytics, instant data visibility, or supporting high concurrency is important. Multiple factors contribute to...
How Sift is accurately identifying anomalies in real time by using Imply Druid
As the leader in Digital Trust & Safety and a pioneer in using machine learning to fight fraud, Sift regularly deploys new machine learning models into production. Sift’s customers use the scores generated...
Making the impossible, possible: A GameAnalytics case study
We’ve had the pleasure of speaking with Ioana Hreninciuc, CEO of GameAnalytics, to learn just how they use Imply to make their next-generation data stack possible.
Make your real-time dashboards blazing fast with per-segment caching
Imagine a scenario where Druid is collecting metrics about a huge microservices application —there’s a continuous stream of metrics coming in about the different services from this application.
Community Spotlight: smart advertising from Sage+Archer + Apache Druid
Out-of-home advertising has changed. Gone are static, uncompromisingly homogenous posters, replaced instead with bright and fluid installations. Installations that make smart decisions about what and when...
Some time ago, Dana Assa and I wrote a detailed blog post about Data retention and deletion in Apache Druid. Our intention was to help Druid database users and provide guidance on how to control the TTL...
Hawk is the first independent European platform to offer a transparent and technological advertising experience across all screens: Desktop, Mobile, CTV, DOOH & Digital Audio.
If you thought you had perfect rollups before, you might have been wrong!
In Apache Druid, you can roll up duplicate rows into a single row to optimize storage and improve query performance. Rollup pre-aggregates data at ingestion time, which reduces the amount of data the query...
Imply’s real-time analytics maturity model to create better customer experiences
Imply’s real-time Druid database today powers the analytics needs of over 100 customers across industries such as Banking, Retail, Manufacturing, and Technology. We have observed that the majority of prospects...
What I wish I knew about Imply when I was developing in-house analytics
Like a lot of engineers at Imply, I got my start here after having worked on an analytics solution for a previous employer. In my case, it was a large non-tech company going through a digital transformation.