How Nielsen Marketing Cloud Uses Druid for Audience and Marketing Performance Analysis
Nov 21, 2019
Itai Yaffe
Nielsen Marketing Cloud provides a way to profile the various audiences that marketers and publishers would like to target on digital media, activate via various ad networks, and then gain insights on that activation after the fact.
How do we do that? First, we collect device-level data (device can be a mobile phone, a laptop, a smart TV, etc.) from online and offline sources, and enrich it using various machine learning (ML) algorithms. This process assigns each device a set of attributes, such as gender, age, interests, demographics – you name it.
For more details and Q & A with the Nielsen team, register for the webinar happening December 11th, 10 AM Pacific
After the data is stored in our systems, our customers can use our SaaS offering to query it in various ways. The most common type of questions is sizing the audience, and this is basically a COUNT DISTINCT question. For instance, determining how many unique devices fulfill a certain criteria or a certain set of attributes that our customers can choose in our dashboards, for a given date range.
We provide them with the ability to input a Boolean formula. They can add as many attributes as they want. The number of combinations is endless. The date range is not predefined, and we have to provide the number of unique devices that fulfill that criteria.
That’s a tough question to answer, especially in real time.
If you’re talking about, say, targeting or campaign analysis, usually we’re interested in a trend. Most of the time, we’re not interested in what the customer or the user browsing the web has done at a specific second in time, but rather, what was the result over time of being exposed to and clicking on an ad.
Historically, we used Elasticsearch to store the raw data (i.e all the events we are collecting). At query time, we had to scan all the data and provide the number of unique devices. As the scale and volume grew – we’re talking about over 10 billion devices today – Elasticsearch was no longer the answer, and we needed to find out a better way to provide those answers.
Just to give you an idea of how this pipeline used to work back then (about four years ago):
Every day, we took a sample of our data (only about 250 gigabytes per day out of the entire daily data), and ingested that sample into Elasticsearch. It took us about 10 hours (!) per day. Now, during that time, the response time of the queries went through the roof. Some queries even timed out, so it wasn’t really scalable.
Also there was the cost. If you want to handle more queries, you had to scale your Elasticsearch cluster, but that wasn’t enough because of all sorts of limitations with the way we modeled our data and with Elasticsearch itself.
Once we understood that Elasticsearch could no longer address the demand, we set out to find a better solution. Some of them were based on other capabilities in Elasticsearch, and some of them were completely outside of Elasticsearch. After some research and some help from fellow Israeli company AppsFlyer, we started pursuing Druid as an alternative. The proof of concept results were really good for us — in terms of scalability, concurrent queries, performance, and cost — so we just went with Druid and never looked back.
We’ve had Druid in production for over three and a half years now. We have several clusters, and one of them has over 20 nodes. The historical nodes are based one of AWS’s largest instances, i3.8xlarge (which as 32 cores and 244GB RAM each, and uses NVMe SSD). We ingest dozens of terabytes per day, though after the Druid rollup pre-aggregation process occurs – we aggregate using daily granularity – we end up with only 40 terabytes of aggregated data for a year’s worth of data!
I think it’s also worth mentioning that we’re using a unique ability Druid provides, which is ThetaSketch. That’s a large part of our solution. Without it, we wouldn’t be able to provide that COUNT DISTINCT capability, because we want to count how many unique devices are relevant for this, say, campaign, not just how many hits a certain webpage receives or something like that.
ThetaSketch lets us perform a very quick approximation of COUNT DISTINCT. It’s an amazing capability that allows customers to build a Boolean formula combining various attributes, which is translated into numerous unions and intersections between those attributes.
For example, how many devices are used by females that are interested in technology? That’s an intersection question. And ThetaSketch helps us to answer it in real time rather than having to try to calculate all of the results beforehand. We have over 80,000 attributes in the system, though not all of them are translated into a dimension in Druid. It really depends on the use case.
We have our web application, our SaaS offering, which the customer can build the Boolean formula. And then this is being sent to our proprietary component that translates that formula into queries via the Druid REST API. A complex Boolean formula from a single user may generate hundreds of Druid queries behind the scenes.
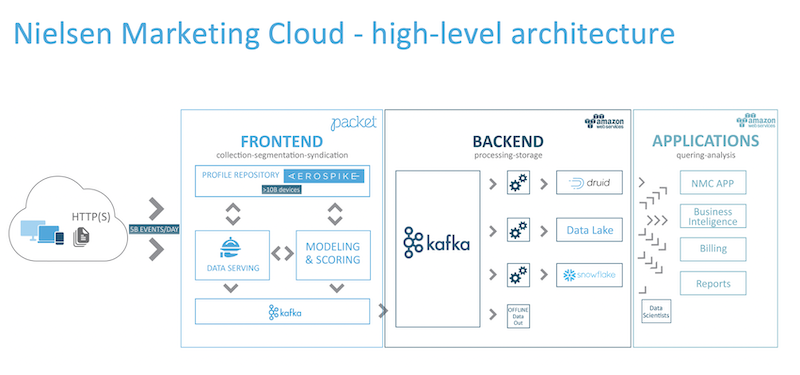
We have a few layers in the system. The first layer is the frontend layer (a.k.a. our serving layer) that receives data from both online and offline sources. An online event can be when someone browses a website, and there’s a redirect to our serving layer. Offline data, on the other hand, comes from files we get from various data partners and alike. Our very fast serving layer processes those events, runs different machine learning algorithms to enrich the data, and then stores it in our data layer. From there we use the Hadoop-based ingestion to ingest the data into Druid.
I think that one of the interesting things in our journey with Druid is that we started off with one use case, which is the COUNT DISTINCT use case that I mentioned earlier, and later on we transformed more use cases into Druid, replacing other tools. Elasticsearch was used for part of one category of use cases, and another category of use cases was served by a distributed MySQL engine. In both cases they were not scalable enough.
For the near future, one of the interesting things we currently are trying to handle is to intersect two attributes with a totally different orders of magnitude. Say you want to know all the US located devices (a large dataset) that are interested in Porsche (a small dataset), for example. When using ThetaSketch, this kind of use case may result in a very high error rate. So we’re researching how we can mitigate this type of queries using machine learning based tools in addition to ThetaSketch.
If you want to hear more or you have questions, sign up for our webinar happening December 11th, 10 AM Pacific
Other blogs you might find interesting
No records found...
May 21, 2026
A First Look at Lumi Loglake: Query Logs Where They Live
TL;DR: Imply Lumi Loglake is a lakehouse (separated compute/storage) architecture for unstructured logs that reduces costs from 40% up to orders of magnitude on your hardware/AWS/Azure bill used to run your...
Imply Lumi Major Release Preview: Continuing the Journey Towards Decoupled Observability/SIEM
We are getting ready to introduce the next major expansion of Imply Lumi and the observability warehouse. When we introduced the industry’s first observability warehouse, the goal was clear: decouple the...
Imply Lumi's Grafana Loki integration is now in Private Preview. The same logs you've loaded into Lumi for Splunk are now queryable natively in Grafana using LogQL with no second pipeline, no duplicate storage,...