Kappa architecture at NTT Com: Building a streaming analytics stack with Druid and Kafka
Jan 08, 2019
Paolo Lucente, NTT
This is a guest post from Paolo Lucente, Big Data Architect @ NTT GIN.
NTT is a global telecommunications company headquartered in Tokyo, Japan Ranked in the Fortune Global 500 list, NTT is the fourth largest telecommunications company in the world NTT Communications (NTT Com) is a subsidiary of NTT and its Global IP Network (GIN) business unit owns and operates one of the world’s largest global tier-1 IP backbones, which provides high-speed, high-capacity IP communication services for major countries in Europe, North and South America, Asia and Oceania.
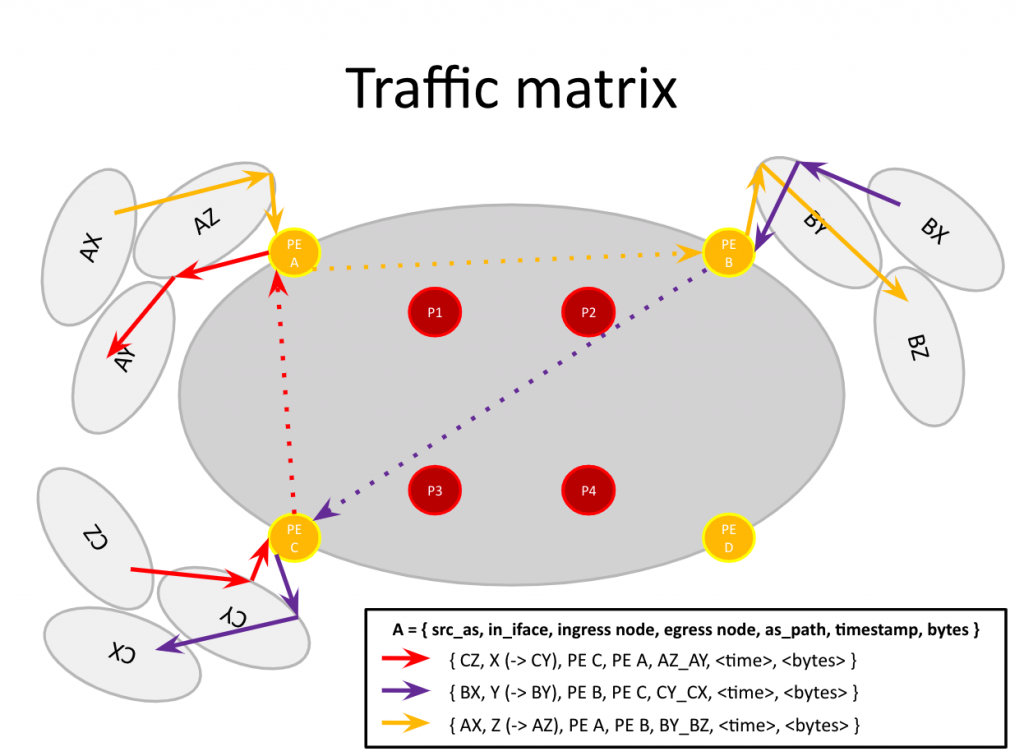
One of the key activities at the heart of any internet backbone is flow analytics, which enables visibility into global traffic for many technical (capacity planning, traffic engineering, etc.), economical (resource optimization, revenue leak detection, etc.), and security use cases Flow analytics at NTT GIN is centered around a “traffic matrix”, a representation of all traffic among all possible pairs of sources and destinations in a given internet domain By providing real-time traffic visibility and rapid explanation capabilities for this data, we unlock tremendous business value for the whole organization.
The legacy flow analytics system that was in place at NTT GIN suffered from several issues:
It was a black box that was difficult to troubleshoot and extend to add new functionality – both on the backend and the frontend.
It was not scaling in a cost performant manner.
There were limited ad-hoc analysis capabilities, which are important to quickly understand data anomalies.
As we considered modernizing our infrastructure, we evaluated building a new solution for flow analytics versus buying an existing product The main problem we saw with existing products was that none of them were a precise match for our requirements We are a massive company and required a lot of custom functionality for our flow analytics, and although some products did include APIs that would allow us to extend them, there were still two concerns from our side: the high cost of the product, and the number of engineering resources required to extend the product If we were going to commit engineering resources, we wanted more flexibility and control So, we decided to build a solution.
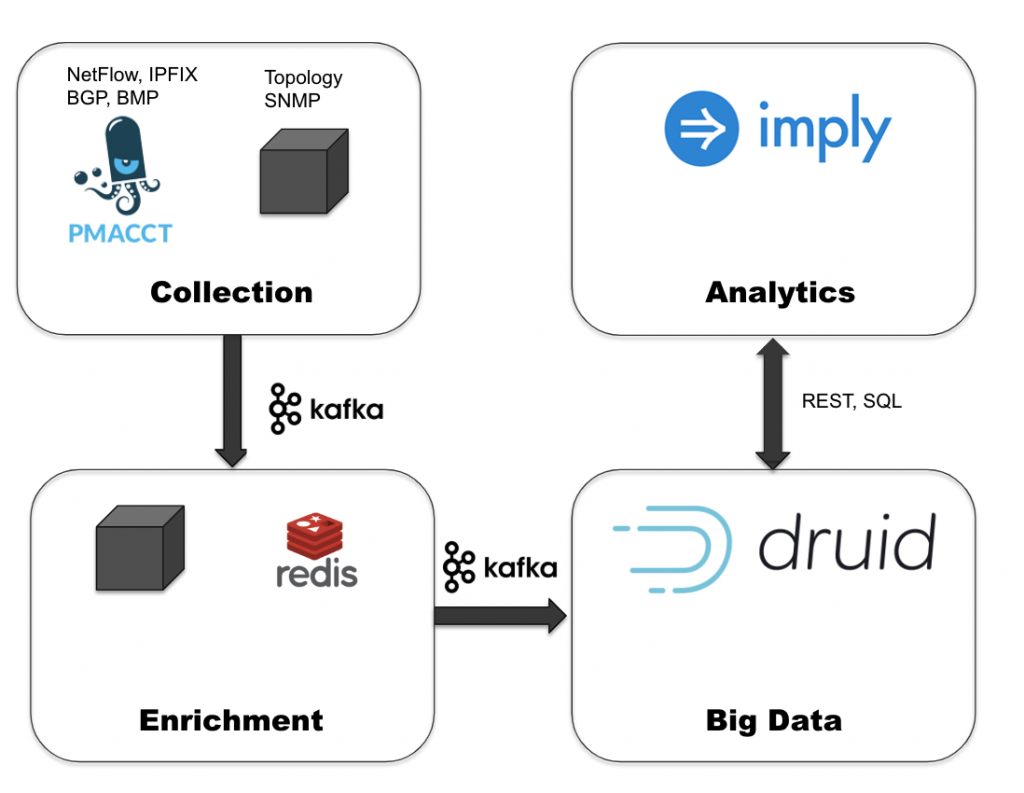
As we began evaluating solutions, we focused on technologies that could scale to our data volumes (“big data” technologies), and tested various alternatives to each part of the new stack we wanted to build. Eventually, we settled on a design where our core architecture would consist of two components: an event bus to deliver data from the traffic matrix, and a query system to collect, store, and analyze this data A small team of engineers conducted an evaluation of the different pieces of the data pipeline After some in-depth evaluation, we selected Apache Kafka as our event bus, in part for its scalability, reliability, and performance during our internal tests For the query piece, we chose Apache Druid Although there were many open-source and commercial solutions to choose from, we were impressed by our internal tests with Druid We found Druid to be more efficient for large-scale analytics compared to log search/document-oriented databases, and required fewer resources to ingest, store, and query the same amount of data than time-series databases In particular, Druid was excellent at providing the equivalent of SQL GROUP BY and WHERE queries on non-time dimensions, an essential feature for doing ad-hoc analytics over our traffic matrix.
In addition to Druid’s query capabilities, one of the most important features it has is the ability to integrate natively with Kafka Druid can consume data exactly once from Kafka, and allowed us to build a complete end-to-end streaming analytics stack This type of architecture is known as a Kappa architecture, and was first described in a popular blog post NTT GIN is one of the first companies in the world to implement this innovative architecture in practice, and so far it has not only solved the problems with our legacy solution, but allowed us to unlock new use cases around data exploration we didn’t have before To complete our stack, we worked with Imply, the company behind Druid, and are leveraging their Pivot UI for data analysis Pivot is easy to use for ad-hoc analysis It has been very simple to generate a wide range of ad-hoc visualizations by simply dragging and dropping database dimensions, which is critical for us to understand anomalous data patterns.
Today our new stack runs in production ingesting more than 100K events/sec While most UI tools (especially flow-centric UI tools) are designed for only one class of users – typically in Operations (for capacity analysis), Engineering (to analyze the traffic matrix directly), or Development, our solution through Kafka, Druid, and Imply’s Pivot enables users at many different levels in the organization to freely explore data, without restricting their access to pre-canned dashboards. Users have already unlocked new use cases for capacity analysis, analyzing the traffic matrix, and inter-domain traffic analysis (peering analysis) Users are also creating their own customized dashboards, and are freely sharing insights throughout different teams.
By having a solid foundation for network flow analysis, and a single environment for infrastructure/topology data, forwarding plane data, and control plane data, we are now planning to expand our work and to add further sources of information to correlate data against This includes data for active measurements (round trip time, jitter, packet loss, etc.), quality of network paths, and RPKI/ROA validation for inter-domain routing security analysis, which is critical for the stability of the global internet for a tier-1 network backbone.
If you are experiencing a situation similar to ours, we highly encourage you to check out Apache Druid and Apache Kafka.
To learn more about how to build a similar stack, please refer to the Data Rivers architecture whitepaper from Imply
Other blogs you might find interesting
No records found...
Jul 24, 2026
Why You Shouldn’t Have to Delete Your VPC Flow Logs
When a security incident happens, investigators almost always start with the same questions: Which systems communicated? Where did the traffic originate? What changed before the incident? Was data exfiltrated?...
Splunk Smartstore vs Lumi Loglake: Two Very Different Ways to Search Logs in Object Storage
One copies data back before it can be searched. The other queries it where it lives. Lumi Loglake lets Splunk teams query logs directly in object storage, including AWS S3, Delta Lake, Apache Iceberg, using...
Supercharging Schema-On-Read: Logs in Object Storage Don’t Need a Data Catalog
Machine data architectures are rapidly changing. As telemetry volumes continue to grow and as costs rise, organizations are increasingly moving logs and other machine data into object stores such as AWS S3....