Imply Pivot delivers the final mile for modern analytics applications
Apr 24, 2023
Matt Morrissey
We blog a lot about Apache Druid. As the real-time analytics database used by 1000s of companies like Netflix, Twitter, and Target, Druid is the right choice for developers building analytics applications at any scale (Become an analytics hero, Build an external analytics app, and Analyze real-time streams to name a few). But an analytics stack isn’t complete without the presentation layer.
Today, I’d like to explore the final mile for building analytics applications – getting those insights into the hands of your end users.
More folks are in need of real-time analytics to make operational decisions based on real-time streaming events. In the world of streaming data, there’s potentially millions of events created per second and the ability to get insights into the hands of people – like operators, end users, or even customers – who can leverage the timeliness of insights is key. Consider the following:
The head of marketing, in an executive meeting, claims a brand new campaign is the driving force behind a recent uptick in user acquisition. Can they substantiate this by slicing and dicing across impressions, interactions, and key conversion metrics, while filtering on campaigns, and dozens of other dimensions in the meeting?
A security analyst responsible for anti-fraud is on-call early one morning when an alert comes in at 3 AM. How do they answer ad-hoc questions across security landscapes with billions of endpoints to act quickly to stop any malicious activity happening in their systems and applications?
A product manager of a giant customer-facing service is responsible for how customers are interacting with the service. Recently, the application team shipped new code. Shortly afterwards user engagement starts to drop. Was this caused by the code release?
Druid is a database that powers these types of scenarios, but what’s the right approach for the UI? How do you deliver an easy and fast way for your end users to access and extract insights from highly granular data?
The challenge folks often face with a traditional BI reporting model (combining a cloud data warehouse with an off-the-shelf visualization tool like Tableau or Looker) is the need to pre-aggregate data to provide the metrics and dimensions your end users want to access at the speed that they need. This creates data fidelity issues because your end users get access to predefined dashboards. Ultimately, the folks that want to interact with the data can’t becuase they lose the ability to slice, dice, and drill down into the raw data, especially at high data volumes.
So where do you turn to find the right UI? At Imply, we are focused on delivering a developer friendly database so developers can easily build analytics applications. One area of our focus is by offering a pre-built UI in case developers want to get started right away. This allows any end user to perform complex slice-and-dice analytical queries in just seconds.
Imply Pivot delivers a paradigm shift for self-service analytics
If you don’t want to build your own UI, you can leverage the combination of Apache® Druid paired with Pivot, a purpose-built visualization engine for Druid.
What makes Pivot so special?
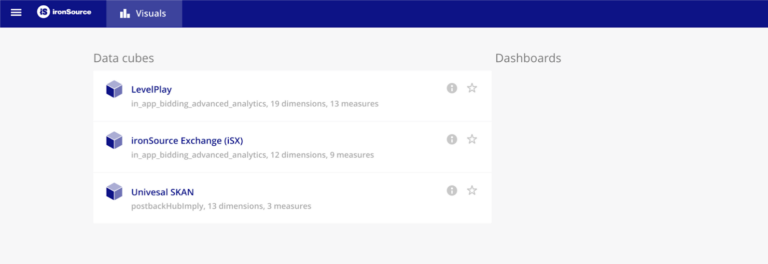
When we designed Pivot, one of our primary goals was to enable your end users to “think” as little as possible. This is why we set out to make data-knowledge transfer simple and straightforward. This led us to create the concept of “Data Cubes.” It’s how we handle multi-dimensional queries within Pivot.
Unlike traditional BI tools that require pre-aggregated data for static dashboards, a data cube is a way for a data savvy person to encode ideas and truths about the data (i.e. what are the KPIs?) and easily share them with a broader team. As a result, end users who may not be data savvy can easily navigate their way around it.
This is why Pivot provides the fastest, interactive analytics for analysts and non-technical business users. Your end users will be able to drag, drop, and drill down, essentially having a live conversation with the data. Everything is instant; anyone can even see query results change as new data flows in. Pivot can also provide alerts when data anomalies appear, to enable users to take a closer look.
Let’s look at how two different companies, Twitch and IronSource, are benefiting from using Imply Pivot.
Empowering all staff to make data-driven decisions at Twitch
Twitch is a live streaming platform used by gamers and internet personalities to interact with fans live. According to Twitch Tracker, there were more than 9.5 million active streamers and a total of over 625 million hours of streams watched in September 2022.
“Our goal as a team is to empower people to find, access, and use data in their decision-making. We can bucket employees and staff at Twitch into two personas: the data staff are folks whose day-to-day activities are writing SQL using BI tools. They live and breathe data at the company and they know where to find the data they care about and what queries to write. The non-data staff, on the other hand, would like to use data to make their decisions. But they don’t spend their day-to-day writing queries or using BI tools. But we want to empower them all—data staff and non-data staff.“
In order to meet this objective, Twitch turned to Druid as a real-time analytics database and chose to partner with Imply to complete the Druid experience. Additional value from Imply included Pivot, allowing Twitch to make it super easy for both their technical and non-technical staff to drill into tons and tons of metrics.
This is no simple task—Twitch processes 8.5 billion real-time events which amount to roughly 1.3 terabytes of data per day. They also ingest 5.6 gigabytes of daily batch events. In total, they have over 50 different data sources.
According to Ngorok, once Twitch implemented a combined solution of Pivot and Druid, “they no longer needed analysts to do analytics.” This means Product Managers (PMs) are now free to explore all types of data to improve the product experience without having to rely on analysts for help.
For example, Twitch has a measure called effective views that make sure views between app and mobile are not double counted. If you are a new person joining Twitch, you don’t need to know how this KPI is computed, you just care about getting accurate data in a simple and timely fashion. Since the formula is encoded in the data cube, anyone needing access to these insights can simply access this with a few clicks in Pivot.
As a result, PMs can now zoom in and out in an instant across petabyte-scale datasets with trillions of rows. They can maintain a birds-eye view with the flexibility to drill drown to granular details. And if they spot a trend, they can slice and dice data through drag-and-drop fields. At Twitch, PMs use Pivot to:
Look at user data over the past year in a specific geography (such as Canada)
Expand the filter to the past five years
Include other countries like the UK, Brazil, and South Korea.
All of this can be done in seconds and does not require any back-and-forth with data analysts.
The adoption of Pivot at Twitch has had a tremendous impact. Over a quarter of the company are active users of Pivot, which results in about 70,000 queries per day!
ironSource extends insights to their customers with ease
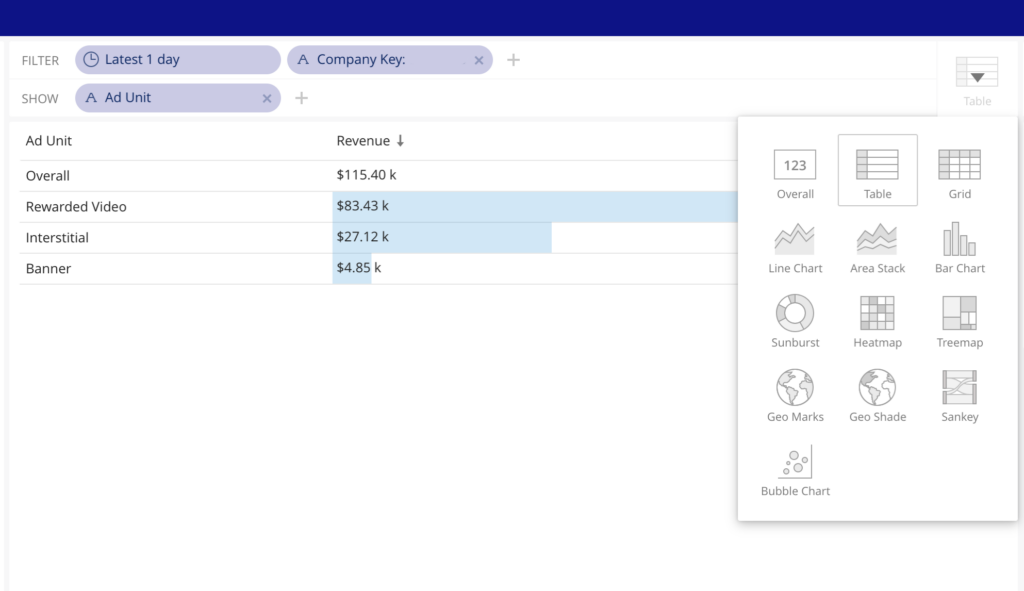
With a suite of fully customizable visualizations (heat maps, bubble charts, histograms, and more) and private-labeled branding, developers can easily deliver interactive experiences for their end users under their own company’s brand.
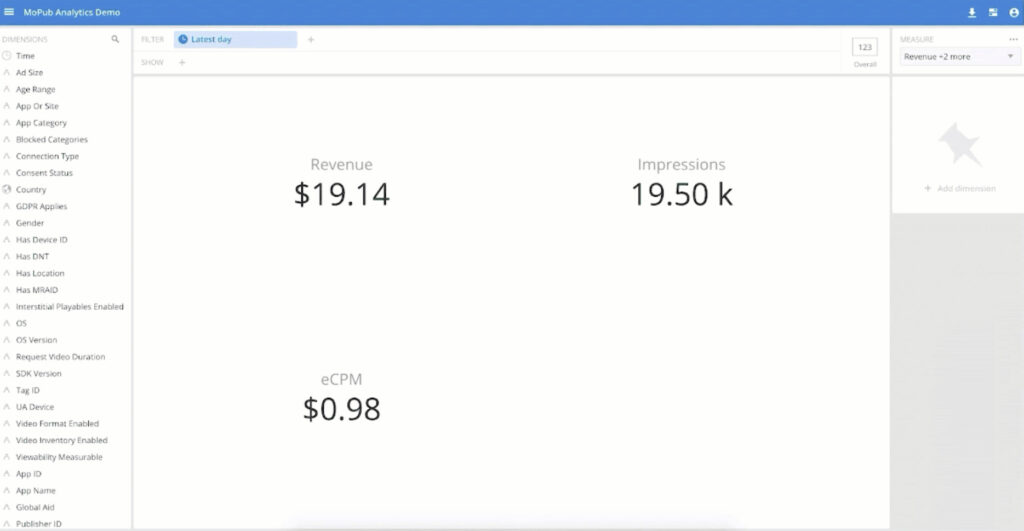
ironSource is the leading business platform for the app economy. They provide services to monetize and scale applications, all using streams powered by Confluent and real-time dashboards powered by Imply.
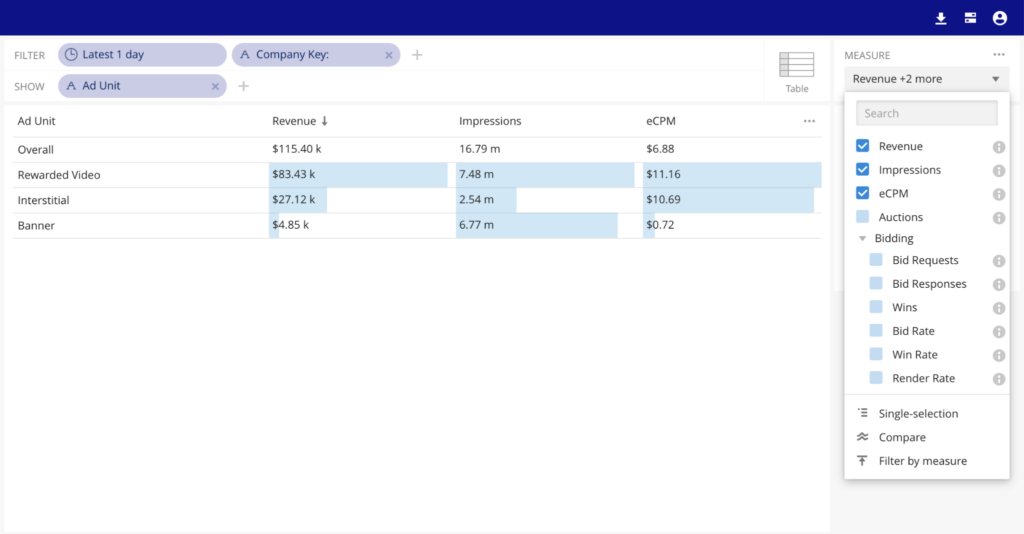
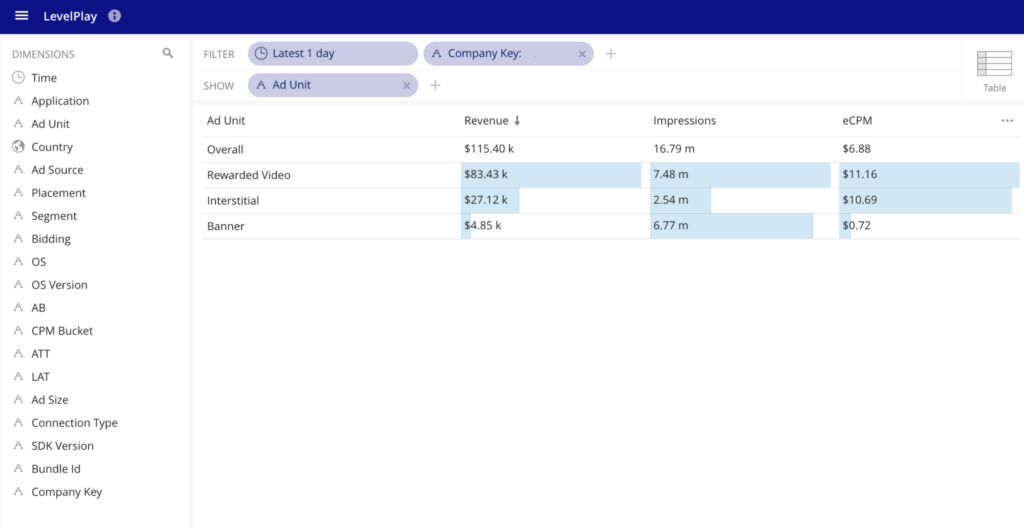
ironSource used Druid to build an external analytics application for their customers. They call the UI customers interact with Real Time Pivot, a white-labeled version of Imply Pivot. This runs at a scale of 2-3 million events per second, with tens of terabytes added per day while serving parallel queries within 1-2 seconds.
They now achieve high throughput without getting backlogs and serve parallel queries with low latency, all at minimal hardware cost.
Here’s what Jonathan Kaplan from ironSource had to say about using Imply Pivot for external users:
“We allow users to query this data using Pivot which is an Imply-provided UI. This allows end users to run extensive queries without a single line of SQL. It’s kind of great. It doesn’t matter if you have any background at all. You can just drop a field and it will generate a query for you.”
Pivot’s ease of use is exactly why many companies have chosen it as their external UI to deliver insights directly to their customers. For ironSource, leveraging Imply Pivot to extend insights to their customers was as easy as counting to 4.
Sign up for a free 30-day trial of Imply Polaris—built from Druid and delivered as a fully-managed DBaaS! Polaris gives you everything you need to build an analytics application in minutes, including an integrated visualization engine based on Pivot.
Streamlining Time Series Analysis with Imply Polaris
We are excited to share the latest enhancements in Imply Polaris, introducing time series analysis to revolutionize your analytics capabilities across vast amounts of data in real time.
Transform your data management with upserts in Imply Polaris! Ensure data consistency and supercharge efficiency by seamlessly combining insert and update operations into one powerful action. Discover how Polaris’s...