Have you ever wanted more visibility in your AWS network traffic? Your AWS VP Clogs contain critical information about the health of your systems, and by collecting,analyzing, and visualizing these logs, you can better:
Diagnose network bottlenecks
Analyze infrastructure performance
Find network security vulnerabilities
Increase application throughput
This blog post is a “how-to” for analyzing AWS VPC logs with Imply. This blog assumes the reader is familiar with AWS and has the necessary security access to perform the tasks outlined in the referenced AWS articles.
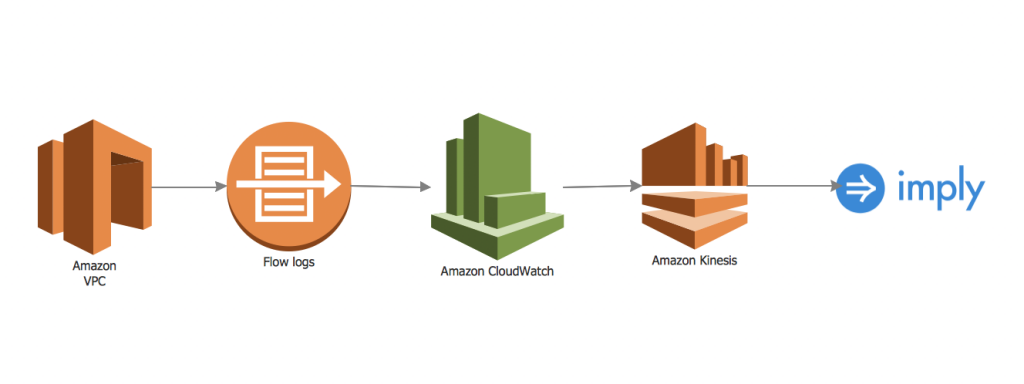
Architecture
In our setup, we will be using AWS Kinesis, AWS Cloudwatch, and Imply.
Collect your flow logs
If you are not already collecting your VPC flow logs, please first refer to the AWS’s docs to get started.
Set up Imply
We will be leveraging Imply as the central analytics engine to store,analyze, and visualize flow logs. Follow these getting started instructions to install Imply.
Ensure imply-utility-belt and druid-kinesis-indexing-service are included as extensions in your common.runtime.properties, similar to below:
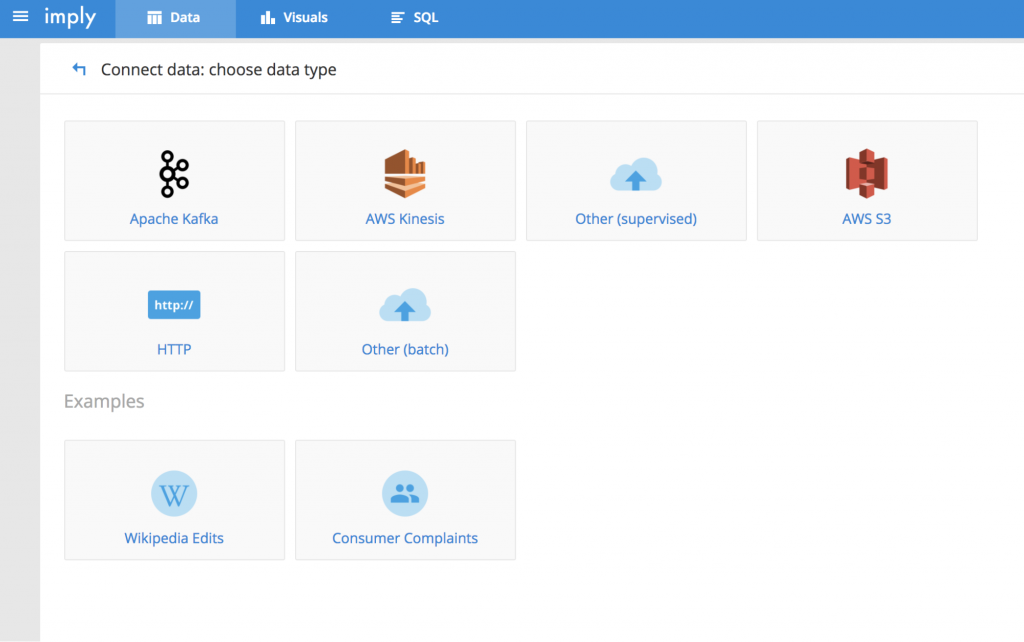
Go to Imply and assign Kinesis as a Data Source in Imply by selecting the Data tab and in the upper left and then + Load data in the top right.
Select Other (supervised).
Paste in the ingestion spec (make sure to update it based on your access credentials in ioConfig).
After you’ve updated the spec with your specific AWS information, select “Send” and then “Submit as supervisor spec”. After the initial overhead of connecting to Kinesis, data should start streaming in to Imply.
You should now be able to load in the provided data cube and dashboard to see your data. Go to the settings page accessible from the user menu.Click Advanced and select Import settings.Paste in the provided data cube and dashboard and click Import
You should now be able to go to the Visuals tab and see your data in the provided data cube and dashboard.
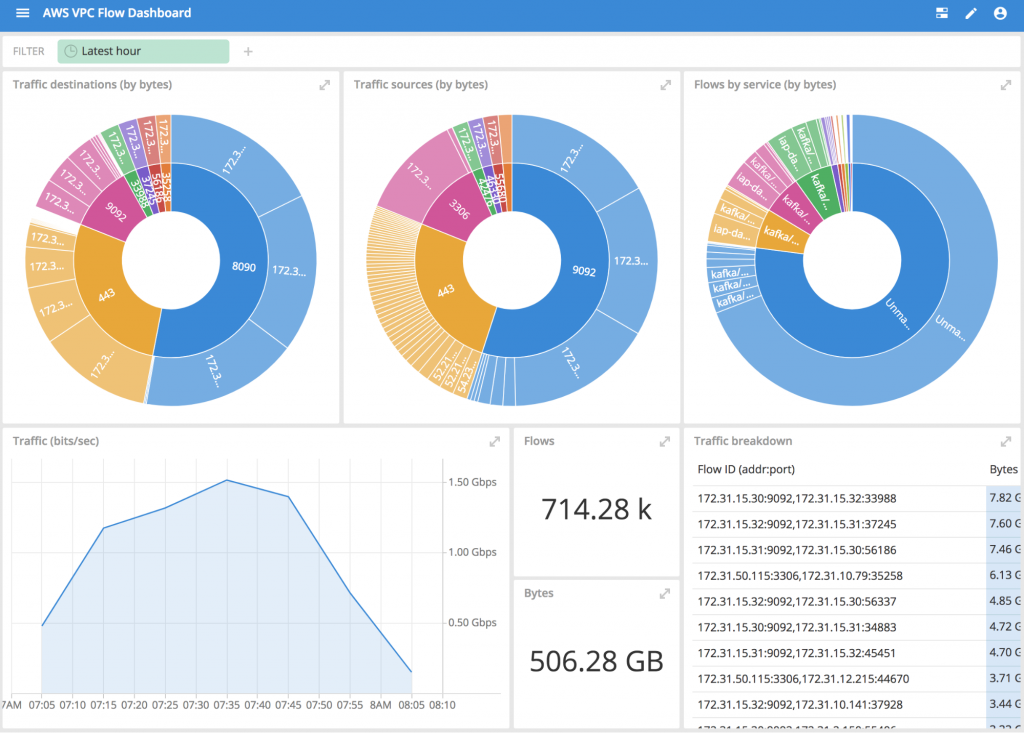
Visualize data
As an example, the following dashboards show interesting views based on AWS VPC Logs.You can modify the provided dashboard and data cube (or create new ones) as you desire.
As you can see from the above, Pivot can be a powerful tool for understanding your AWS VPC log data and providing interesting insights for a number of operational use-cases in seconds.If you’d like to learn more about how Amazon AWS VPC logs can add value for your company, contact us.
Other blogs you might find interesting
No records found...
Jan 30, 2025
2024 Product Innovation Recap
We’ve made a lot of progress over the past decade. As we reflect upon the past year, we’re proud to share a summary of the top 2024 product updates across both Druid and Imply.
2024 was a banner year,...
Druid Summit Lakehouse Panel: A Deep Dive into Data Lakehouses and Apache Druid
At the inaugural in-person Druid Summit this past October, industry leaders gathered to explore the future of data, streaming analytics, and more. In these panels industry experts answered questions about streaming...
Recap: Druid Summit 2024 – A Vibrant Community Shaping the Future of Data Analytics
In today’s fast-paced world, organizations rely on real-time analytics to make critical decisions. With millions of events streaming in per second, having an intuitive, high-speed data exploration tool to...