Batch loads into analytic platforms are still the norm and the trend is moving towards more data being processed and served for ad hoc querying, which requires low latency performance. When Hadoop is involved in pushing data into Druid, performance of the Hadoop indexer is key. The challenge is that as the size of the dataset grows, the previously running Hadoop indexer job is no longer applicable. It has to be tuned to meet the ingest SLA, especially when the size of the dataset is in 10s or 100s of terabytes. The good news is that once the Hadoop indexer job is tuned for this scale, it will work for larger data sets, with the only variable being the available resources in Hadoop.
There are several things to consider when running a large scale Hadoop indexing job.
- Hadoop YARN Queue size
- Job Priority and Preemption
- Network throughput
- Number of file splits
- Memory management for mappers and reducers
- Number of Shards
- Block size
- Tuning Spill for Reducer
When working on a shared Hadoop cluster, the YARN queue is subdivided accordingly and there’s strict enforcement of the maximum amount of memory in the queue that can be used by any given user or group. Each queue also has its own priority.
I recently experienced the following: A 60TB raw dataset was ingested in around 6 hours (10TB/hr) using a 40TB queue size. There were several test runs using smaller queues, but these runs took a very long time to finish the ingest. It was clear that the performance of the ingest was directly proportional to the size of the queue.
Job priority and preemption go hand-in-hand. Any job that comes in with VERY_HIGH priority will preempt other jobs with lower priority. Meaning YARN will kill mappers and reducers from other running jobs to guarantee minimum memory requirements for the higher priority indexing job. For a very large Hadoop indexing job to finish on time, set the priority level to VERY_HIGH. You will know if other jobs are taking away resources from your indexing job when you see error exit code of either 137 or 143 from mappers and reducers.
Compressing the output of the mappers will reduce the latency to write it to disk and hand it to reducers. Consider compressing the input files for the mappers. Both Snappy and LZO are good options but I prefer LZO when the files are larger than the block size because its splittable, and this promotes more parallelism. It will also prevent it from taking too much space in the network.
The network between Hadoop and Druid will define how fast segments can be pushed to deep storage, and how fast it can be published and balanced to historicals. Scheduling indexing jobs when the Hadoop cluster is not that busy will help, but often there’s a very small time available to take advantage of. What will further complicate the publishing of segments is when the Hadoop cluster is on-prem and druid is in cloud, and hdfs is used as a deep storage.
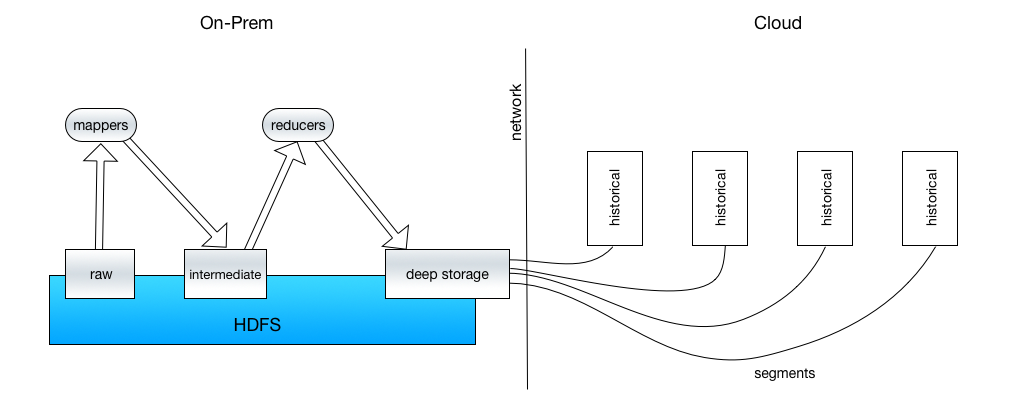
Fig. 1. Segment Publishing
In Fig. 1 above, the amount of time taken to publish the segments to Druid will depend on the speed of the network link is between the two data centers. Network usage needs to be monitored during indexing to ascertain peak throughput. Of course, co-locating Hadoop and Druid is ideal.
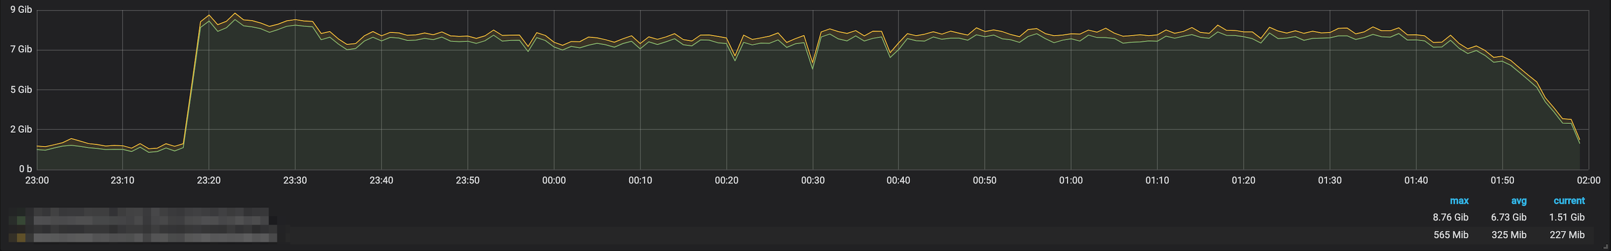
Fig. 2. Saturated Network During Segment Publishing
As shown in Fig. 2, the total segment size being published to Druid in the cloud was around 12 TB over 9 Gbps of network bandwidth. It maxed out at 8.76 Gbps since there is other non-Druid data running through the network. Increasing bandwidth above 9 Gbps, for example to 40 Gbps, will improve the segment sync time by 4x.
Knobs for tuning performance
The following properties below are the knobs that can be turned to improve the performance of loading/dropping of segments and distributing the segments uniformly across historicals.
druid.coordinator.loadqueuepeon.type
This helps with balancing the segments, segment loading or drops across historicals. The default value is curator which is single threaded. It is best to use http since this is more performant and is multi-threaded.
druid.coordinator.loadqueuepeon.http.batchSize
This defines how many segments to load/drop in one HTTP request. Increase this value until the network is saturated. This must be smaller than druid.segmentCache.numLoadingThreads. The default value is 1 but can be increased. In one of our very large indexing jobs, setting this value to 30 was optimal.
druid.segmentCache.numLoadingThreads
Concurrently loading/dropping segments from deep storage is the goal of this property. The default value is 10. Be careful not to set this too high as the I/O will saturate and queries are significantly impacted especially if indexing and querying are happening at the same time. As you increase the value, monitor the I/O and network throughput. You can use iostat to monitor how much data is written/read via the metrics MB_wrtn/s and MB_read/s. If you keep increasing the value and there is no more improvement on MB_wrtn/s and MB_read/s, then there is no more bandwidth left to consume.
balancerComputeThreads
Sets how many threads will be used to balance the segments across the historicals. The default value is 1. If you see in the coordinator log that the balancer cycle is taking more than a minute, increase the value until there are no more segments stuck in the pipe. You should see the occurrence “Load Queues:” which get logged once per run.
maxSegmentsToMove
Specifies the ceiling for how many segments can be moved at any given time. If the input data to be indexed is greater than 10 TB, using at least 600 will make the segment balancing much faster. This also depends on the network bandwidth Druid is running on. Cloud providers typically have a very good ways of increasing the network pipe such as # of cpu cores, # of vNics that can be attached to vms, etc.
maxSegmentsInNodeLoadingQueue
The default value to this is 0 which is unbounded. It is always a good idea to cap this at a certain number so segment publishing is controlled at a rate the network can support. You can start with 100 and increase from there.
druid.coordinator.balancer.strategy
There are 3 types of balancers – cachingCost, diskNormalized and random. It is recommended to use cachingCost as this is more efficient in distributing the segments across historicals evenly.
druid.segmentCache.numBootstrapThreads
For very large clusters, it is recommended to use higher than the default value of 10. For example, if you have an off-heap value of at least 100 GB on each historical and the average segment size is 500 MB, you have about 200 segments that you can fit into that memory. Applying this value will speed up the loading time of segments 20x upon startup.
Given a very large dataset to index, the default 10,000,000 maximum split size in the Hadoop cluster might not be enough. Set mapreduce.job.split.metainfo.maxsize = -1 which means unlimited splits.
This begs the question of if I have this many mappers, how many reducers should I use and what memory settings should I apply in the containers since there are over a hundred million of blocks to be processed? If the number of mappers and reducers are not set right and the allocated memory is insufficient, you will get the following error.
- Socket timeout error
- Exit Code 137, which means not enough memory for the yarn container
- Exit Code 143, which is similar to Exit Code 137. Sometimes this could also mean an unstable DataNode.
For a 10 TB/hr ingest rate, the parameters used were the following. Anything lower than these settings will either make the indexing very slow or will lead to a lot of failed containers.
- mapreduce.map.memory.mb = 5461
- mapreduce.map.java.opts = 4096
- mapreduce.reduce.memory.mb = 12288
- mapreduce.reduce.java.opts = 9216
The number of reducers is determined by the numShards or targetPartition size property in the ingest spec. The formula below explains a starting point for determining the correct number of reducers.
# of reducers = # of partitions by segmentGranularity x numShards
If your ingest spec is using segmentGranularity of MONTH and there are three months of data to be indexed and the numShards specified is 5,000, then the total number of reducers is 15,000. This might require an iterative approach to ensure that the segment size is between 300 MB to 700 MB. This is critical since the foundation of query performance lies in the size of the segments. If the last reducer takes a very long time to finish, this means that the number of reducers is very high or the memory settings are very low.
Enabling the reducers to start reading the output of the mappers also speeds up the job. Not by a big factor but the impact is noticeable for a very large job. You can define how many reducers that will start reading data from map outputs by using mapreduce.job.reduce.slowstart.completedmaps property. Using 0.8 value for this property allowed for a good performance between mappers and reducers.
Container re-use
Also, always reuse your containers. Setting up and tearing down containers takes time and by reusing them, reducers can run faster. Use this parameter to specify how much containers you want to reduce: mapred.job.reuse.jvm.num.tasks. A rule of thumb is to specify the total number of reducers.
Block size
Block size matters in large scale Hadoop indexing for Druid. It reduces the mapper and reducer time up to a factor of 3 when using 512 MB vs. 128 MB. This reduces shuffling time, loading time of the blocks, effectively using memory, reduces cpu time spent, and less failures mean faster container job execution.
The Goal – Only One Spill to Disk
The factor which has the biggest impact on job completion is how you manage I/O operations in Hadoop. All of the memory management recommendations above greatly reduce the trips to disk. Ideally, mappers and reducers should only spill to disk once. More than that will exponentially slow the job. As shown in Fig. 3 below, if you take the ratio of spilled records for mapper and reducer, it should be less than or equal to 1. Listed below is the formula to measure the number of spills to disk.
number of spills (map) = spilled records/map output records = <=1
number of spills (reduce) = spilled records/reduce input records = <=1
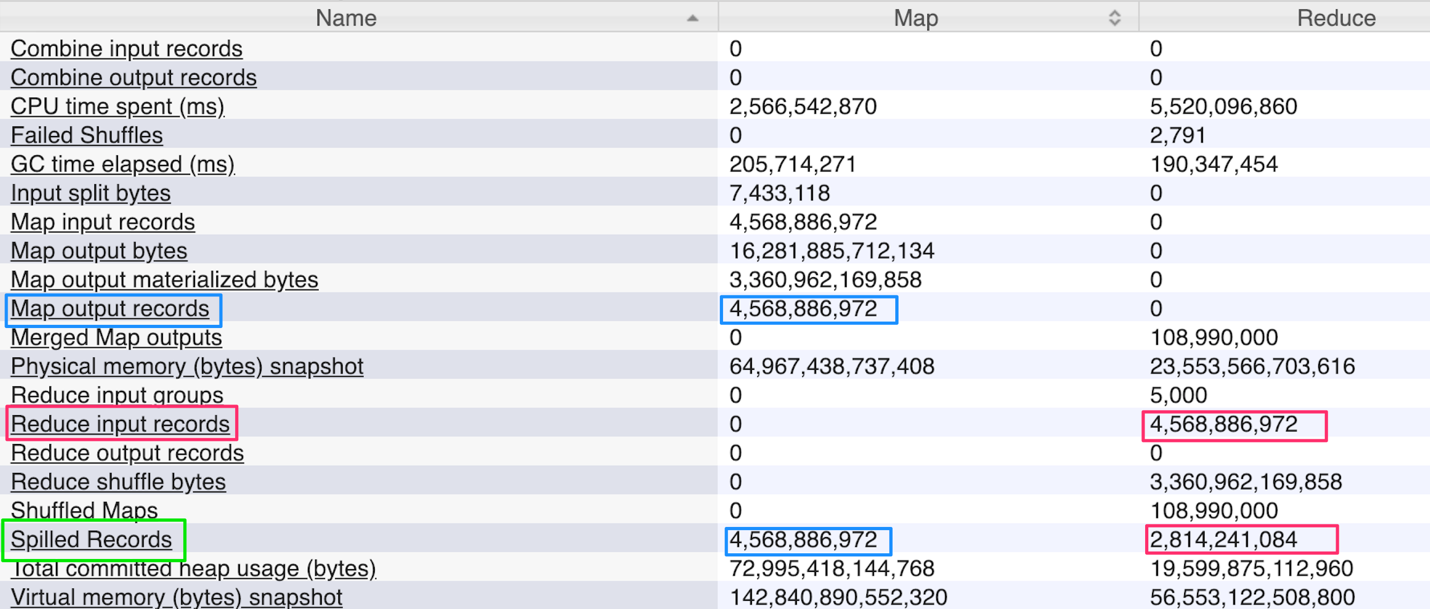
Fig. 3. Job Counters for Map/Reduce
Based on the formula given above, in Figure 3 the # of spills (map) is 1 while for reduce spills is 0.6. This is a very efficient Hadoop indexing job.
With a shared Hadoop cluster, it is very common to have a lot of failures, especially for very large jobs. But most of the failures can be controlled based on all the recommended settings above. Once you reach this kind of efficiency, all you have to consider is adding more machines to process larger datasets.
A great way to get hands-on with Druid is through a Free Imply Download or Imply Cloud Trial.