Building high performance logging analytics with Polaris and Logstash
Apr 01, 2022
Jad Naous
The current crop of logging solutions out there is great for unstructured search. However, these solutions fall flat when it comes to analytics on potentially hundreds of columns with potentially high cardinality. This makes it particularly problematic to analyze logs such as HTTP access logs which may contain millions of IP addresses or paths and billions of url paths.
At this point users often reach out for systems like Druid. In this blog, I’ll show you how to connect Logstash, a tool for collecting logs typically used as part of the ELK (Elasticsearch + Logstash + Kibana) stack, to push data to Imply Polaris, our Database-as-a-service offering powered by Druid. As part of the solution, we’ll also be using Polaris’s built-in analytics capabilities, instead of Kibana for visualizations and analysis.
Logstash, the L in ELK, is a tool that helps aggregate logs, parse them, and push them to a sink. You can think of it as running one or more processing pipelines where events come in on one end, and structured events get sent out of the other. For the purposes of this tutorial, let’s set up an Apache HTTP server with Logstash configured to read access logs and forward them to Polaris. In a production setup, you’re more likely to use Filebeat and connect it to a more centralized Logstash server that parses and forwards events to Polaris.
We’ll be using Logstash’s file input plugin and HTTP output plugin to read the access logs and push them to Imply.
Set up Polaris
If you haven’t already done so, sign up for a Polaris account at https://imply.io/polaris-signup and log in. You can proceed with the other pieces of this tutorial while your environment is spinning up and come back here when ready.
Create an API client
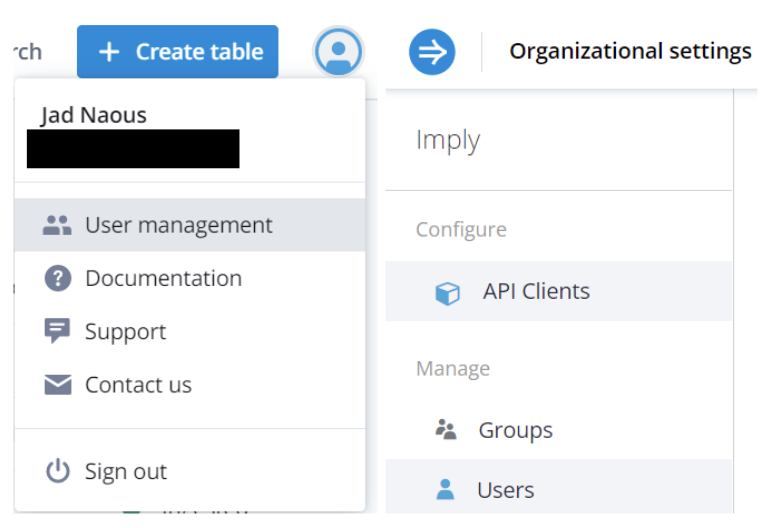
Now that you’ve logged in, create an “API client” to identify your application with Polaris. Polaris uses OAuth2 to authenticate API calls. Simply navigate to the User management console and then click API Clients:
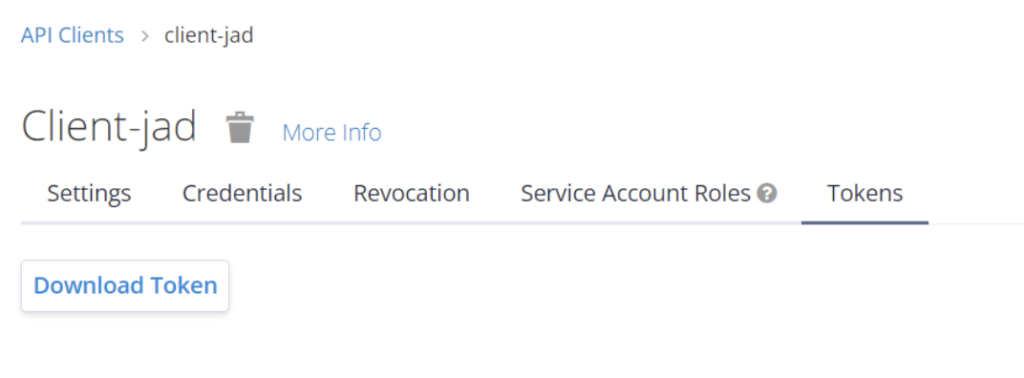
There, create a client. Because Logstash’s HTTP endpoint doesn’t support OAuth out of the box, we’re going to create a long-lived access token that will be used in this example. Set the Access Token Lifespan to the duration for this tutorial, say 1 day. Go to the Tokens tab and download the token. Open the downloaded JSON file, and get the token. You’ll need this token later for your Logstash configuration.
Be careful with this access token. Anyone in possession of that token can execute any APIs as you. A better approach is to create a user with more limited access (a more targeted set of permissions) that can only send data. An even better approach is to write some code using Logstash’s Ruby filter plugin to acquire an access token as needed, but that’s beyond the scope of this blog. See the Polaris Developer guide for more details.
Create a table
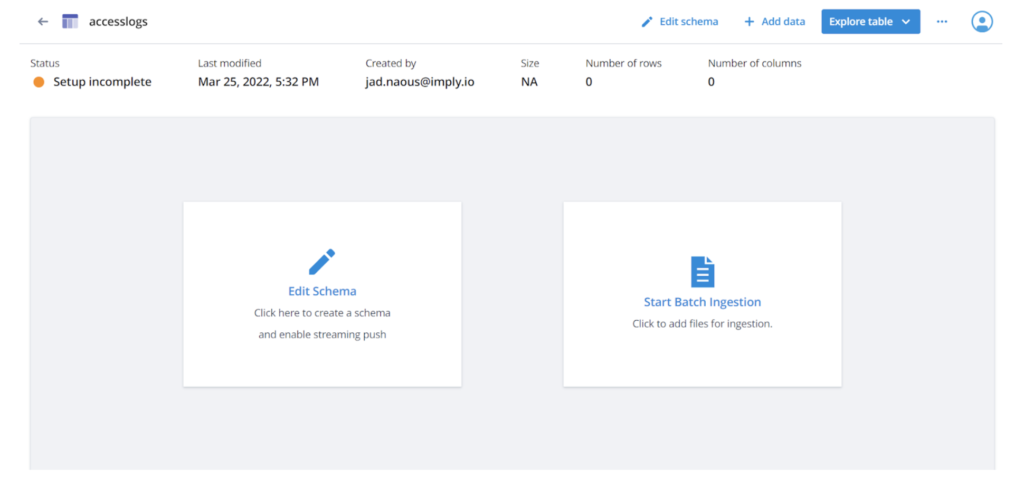
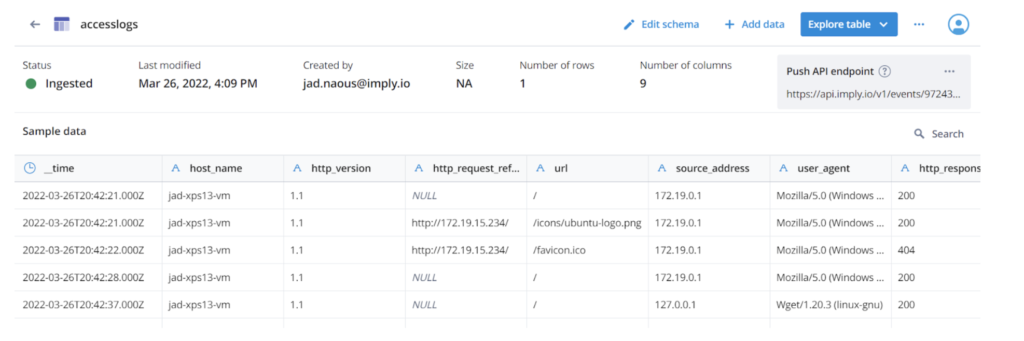
Next, in the Data section in the left navigation, click Tables > Create table. Give your table a name. I called mine “accesslogs”.
In the table detail page, click Edit Schema. Add the following columns:
host_name as string to store the name of the host where the log message is read
http_version as string to store the HTTP version on the request
http_request_referrer as string to store the referrer, if present
http_request_method as string to store the verb used on the request, ie POST, GET, etc
url as string to store the request url
source_address as string to store the client address
user_agent as string to store the User-Agent header if present
http_response_status_code as string to store the status code. I chose string as type because Druid does not index numeric fields (yet!)
http_response_body_bytes as long to store the size of the response body
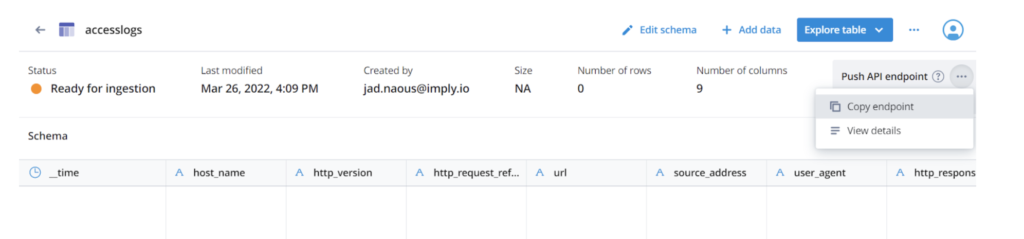
After you save the schema, the UI displays the API endpoint where you can push individual events. Copy that endpoint URL and save it! You’ll use it later to push logs to the table.
Set up Apache HTTP Server
If you don’t already have a working web server with logs you’d like to use, you can follow this section to get a server working on Ubuntu. For this tutorial, I installed Ubuntu 20.04.4 LTS into a VM. Then I installed the Apache server using:
If you already have a working server, you might just want to use the access logs from that server. This tutorial will use the default access log path on Ubuntu at /var/log/apache2/access.log.
Create a file called my-polaris-pipeline.conf inside the config directory with the content below. Replace the <events_endpoint> and <access_token> placeholders with the URL of your table’s endpoint and your access token respectively:
Display Logstash my-polaris-pipeline.conf
input {
# This section tells logstash to read the access log file
file {
mode => “tail”
path => [“/var/log/apache2/access.log”]
start_position => “beginning”
}
}
# This section parses the access log
filter {
# Use the grok filter to parse the apache access log here
grok {
match => {
“message” => “%{COMBINEDAPACHELOG}”
}
}
# We need to parse the timestamp coming from the access log correctly. This tells logstash how
# to read the time from the access log
date {
match => [ “timestamp”, “dd/MMM/yyyy:HH:mm:ss Z”]
}
# And we need to flatten the fields that we’re reading from the log to push them
mutate {
rename => {
“[http][version]” => “[http_version]”
“[http][request][method]” => “[http_request_method]”
“[http][request][referrer]” => “[http_request_referrer]”
“[http][response][status_code]” => “[http_response_status_code]”
“[http][response][body][bytes]” => “[http_response_body_bytes]”
“[url][original]” => “[url]”
“[source][address]” => “[source_address]”
“[host][name]” => “[host_name]”
“[user_agent][original]” => “[user_agent]”
}
# Polaris requires a __time field. We store the parsed event timestamp in __time
copy => {
“@timestamp” => “__time”
}
# We remove everything else that we don’t need
remove_field => [ “http”, “event”, “process”, “source”, “host” ]
}
}
# This section tells Logstash where to send the data
output {
# Use the http output plugin
http {
# Set the URL to your table’s event endpoint here by replacing EVENTS_ENDPOINT
“url” => “EVENTS_ENDPOINT”
“http_method” => “post”
“format” => “json”
# This is where we’ll use the access token. Replace ACCESS_TOKEN below with your access token from the downloaded file.
“headers” => {
“Authorization” => “Bearer ACCESS_TOKEN”
}
}
}
From the logstash directory, start Logstash as follows:
Navigate to your Polaris environment and open your table detail to see your log data flowing!
Use cURL to run HTTP requests to generate some Apache access log entries. For example:
$curl http://localhost
Explore data with Polaris analytics
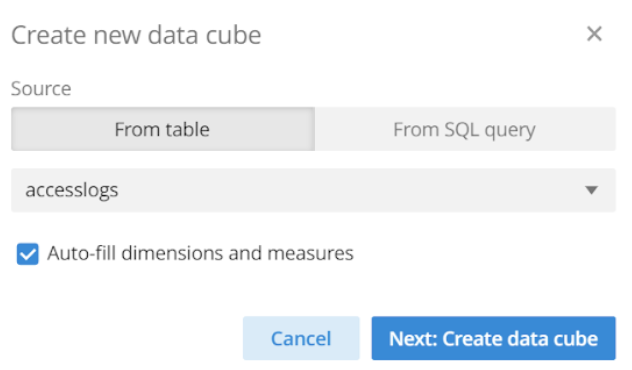
Let’s create a data cube with Polaris to visualize our data:
Click Data cubes under Analytics in the left navigation
Click New data cube on the top right.
Select your table from the drop down and click Next: Create data cube.
You don’t need to modify the data cube settings. Just click Save.
Now you can access your new data cube to explore your data:
This blog won’t go into too much detail about visualizations. For that, I recommend reading through the documentation for Pivot, the Imply Enterprise data visualization tool. For now, let’s try a couple of things.
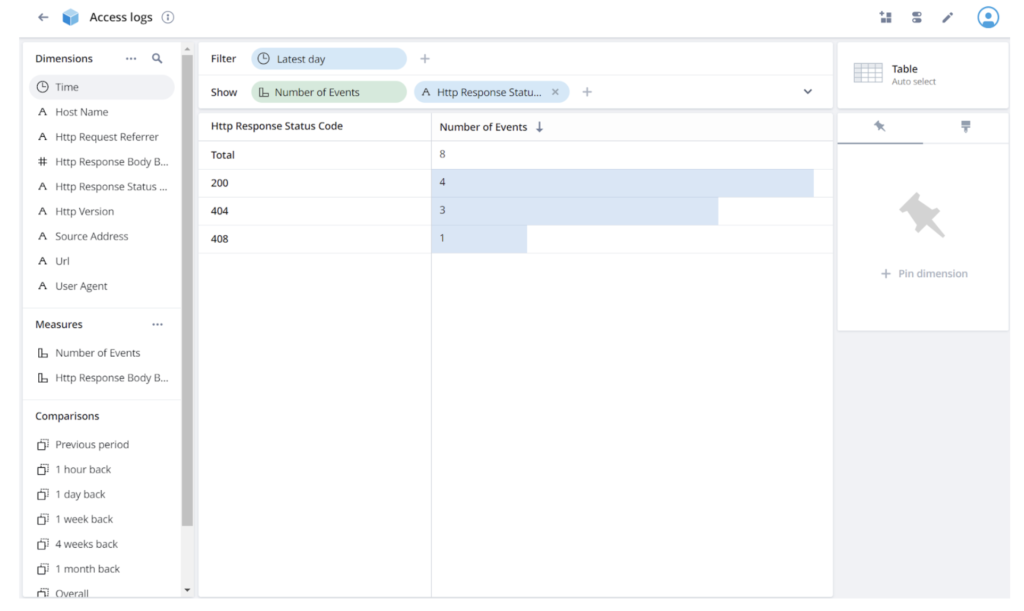
First, let’s break down the records by status code. Drag and drop “Http Response Status Code” from the left panel under Dimensions to the Show bar:
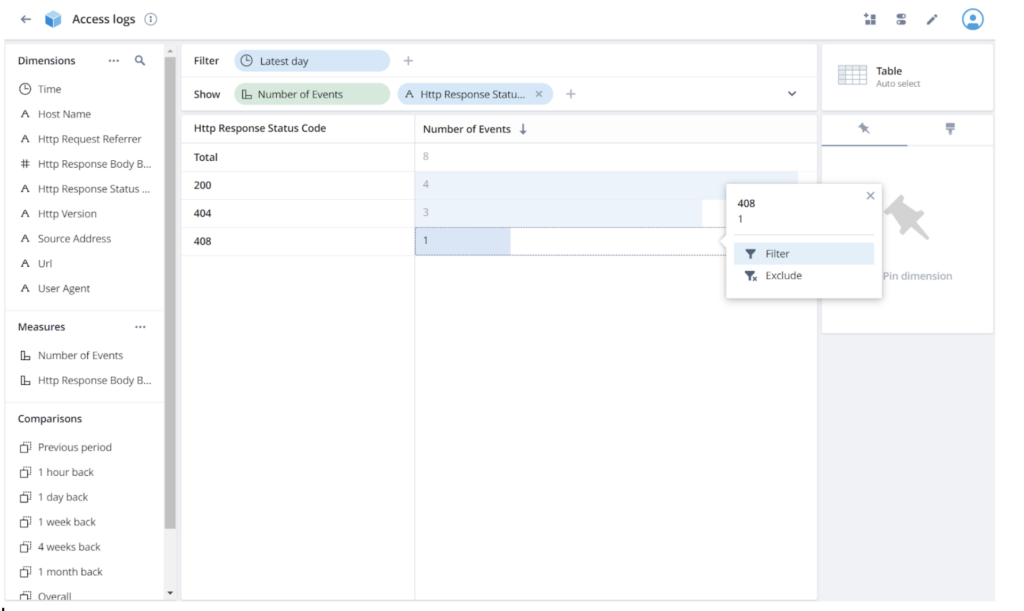
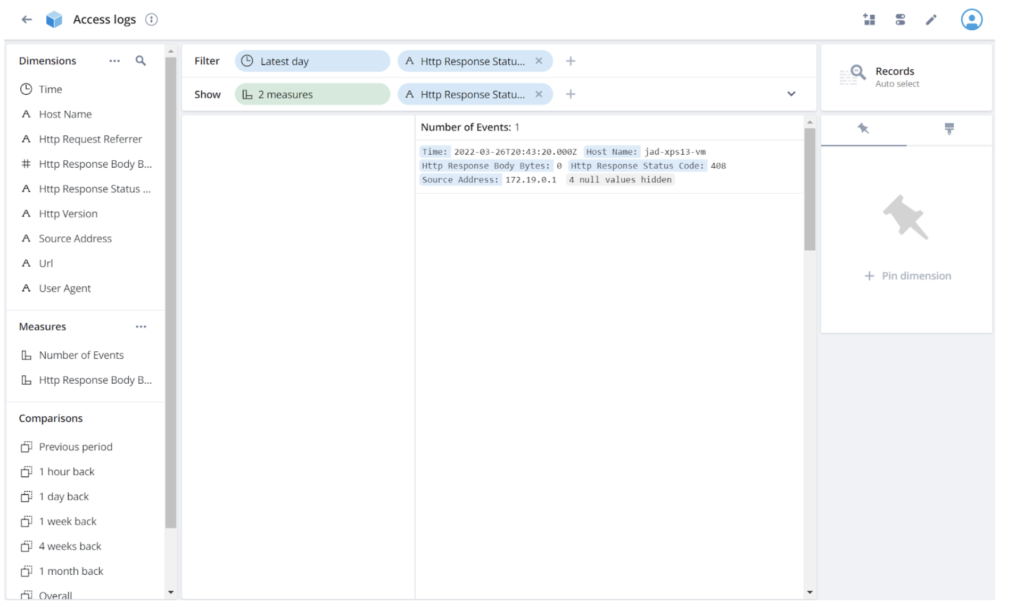
Interesting. I didn’t even try to generate a 408 response. I wonder what that is. Click on the 408 response and select Filter:
Now let’s view that record directly. Click the visualization selector, currently Table on the top right, and choose the Record view:
Cool! You can now use Polaris’s built-in analytics capabilities to slice and dice the Logstash data and build dashboards.
In this blog I’ve shown you how to do a basic configuration of Logstash to parse Apache HTTP Server access logs, push them to Polaris, and then analyze them with Pivot.
Streamlining Time Series Analysis with Imply Polaris
We are excited to share the latest enhancements in Imply Polaris, introducing time series analysis to revolutionize your analytics capabilities across vast amounts of data in real time.
Transform your data management with upserts in Imply Polaris! Ensure data consistency and supercharge efficiency by seamlessly combining insert and update operations into one powerful action. Discover how Polaris’s...