When building streaming data ingestion on Apache Druid®, one of the goals is to consistently deliver insights about the most recent events. During ingestion it is desirable to maintain a low and consistent latency between the time of the event and the availability of the event in the target Apache Druid database ready for querying.
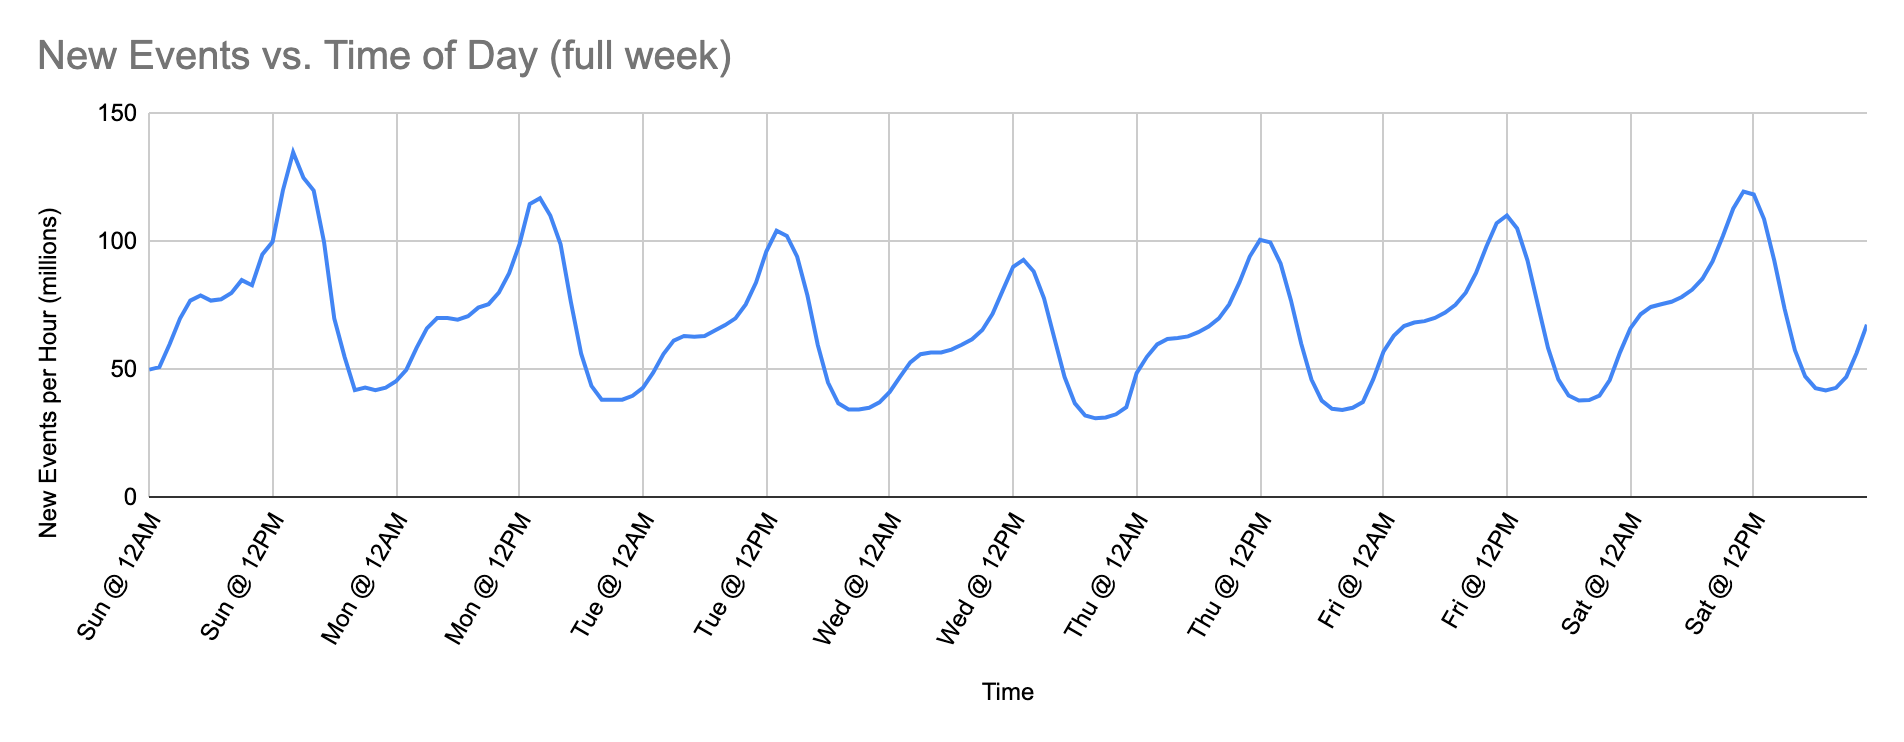
Many sources of event data have a natural ebb and flow directly proportional to the activity they model. As the activity increases it generates more event data; as it decreases it generates less. A typical example of this is eCommerce sales data which varies during different times of the day, and with monthly or yearly patterns of increased activity (think weekends, sales and promotions, paydays, holidays and other such periods of increased activity).
Fixed Resources
Given a variable volume of data and a fixed set of resources with which to process it, one is left with 2 choices:
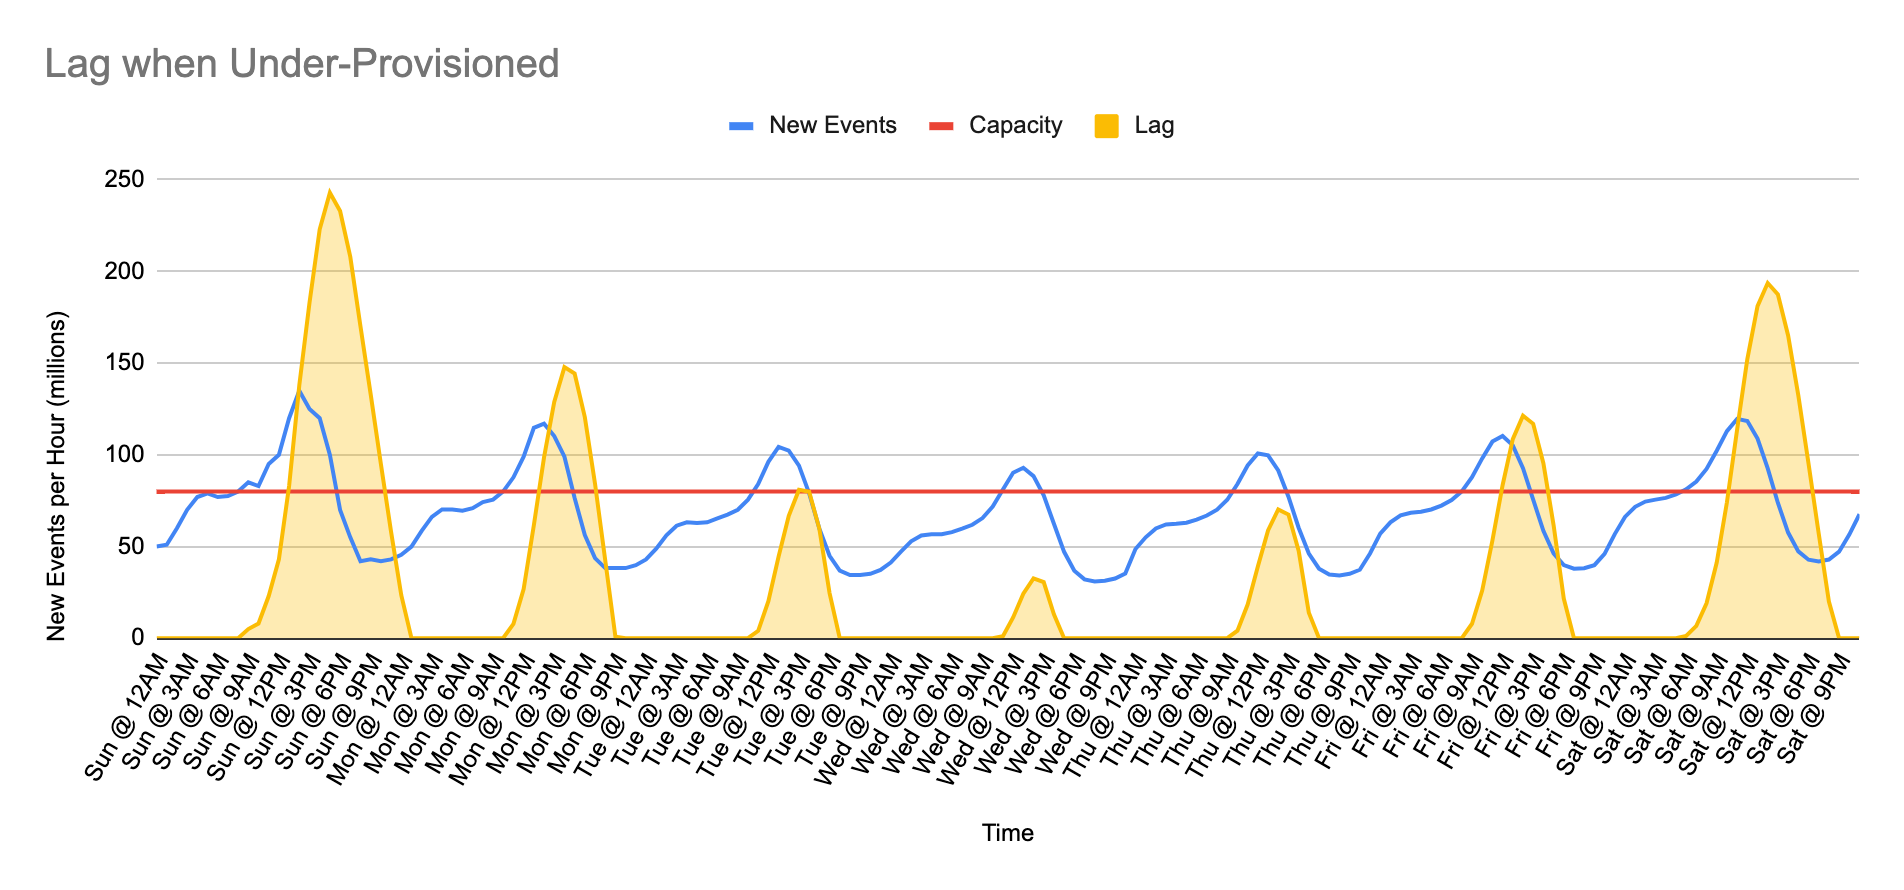
Since there aren’t enough resources, lag begins to grow when arrival of new events exceeds capacity and lag increases until demand subsides below capacity. At that point lag begins to decrease and processing is able to catch up after some time as long as there is enough spare capacity before the next traffic peak. In the example above we can see that stream processing spends half of each day or more catching up and therefore delaying the ability to query that data. On Sundays, this example shows at least 15 hours of delayed processing.
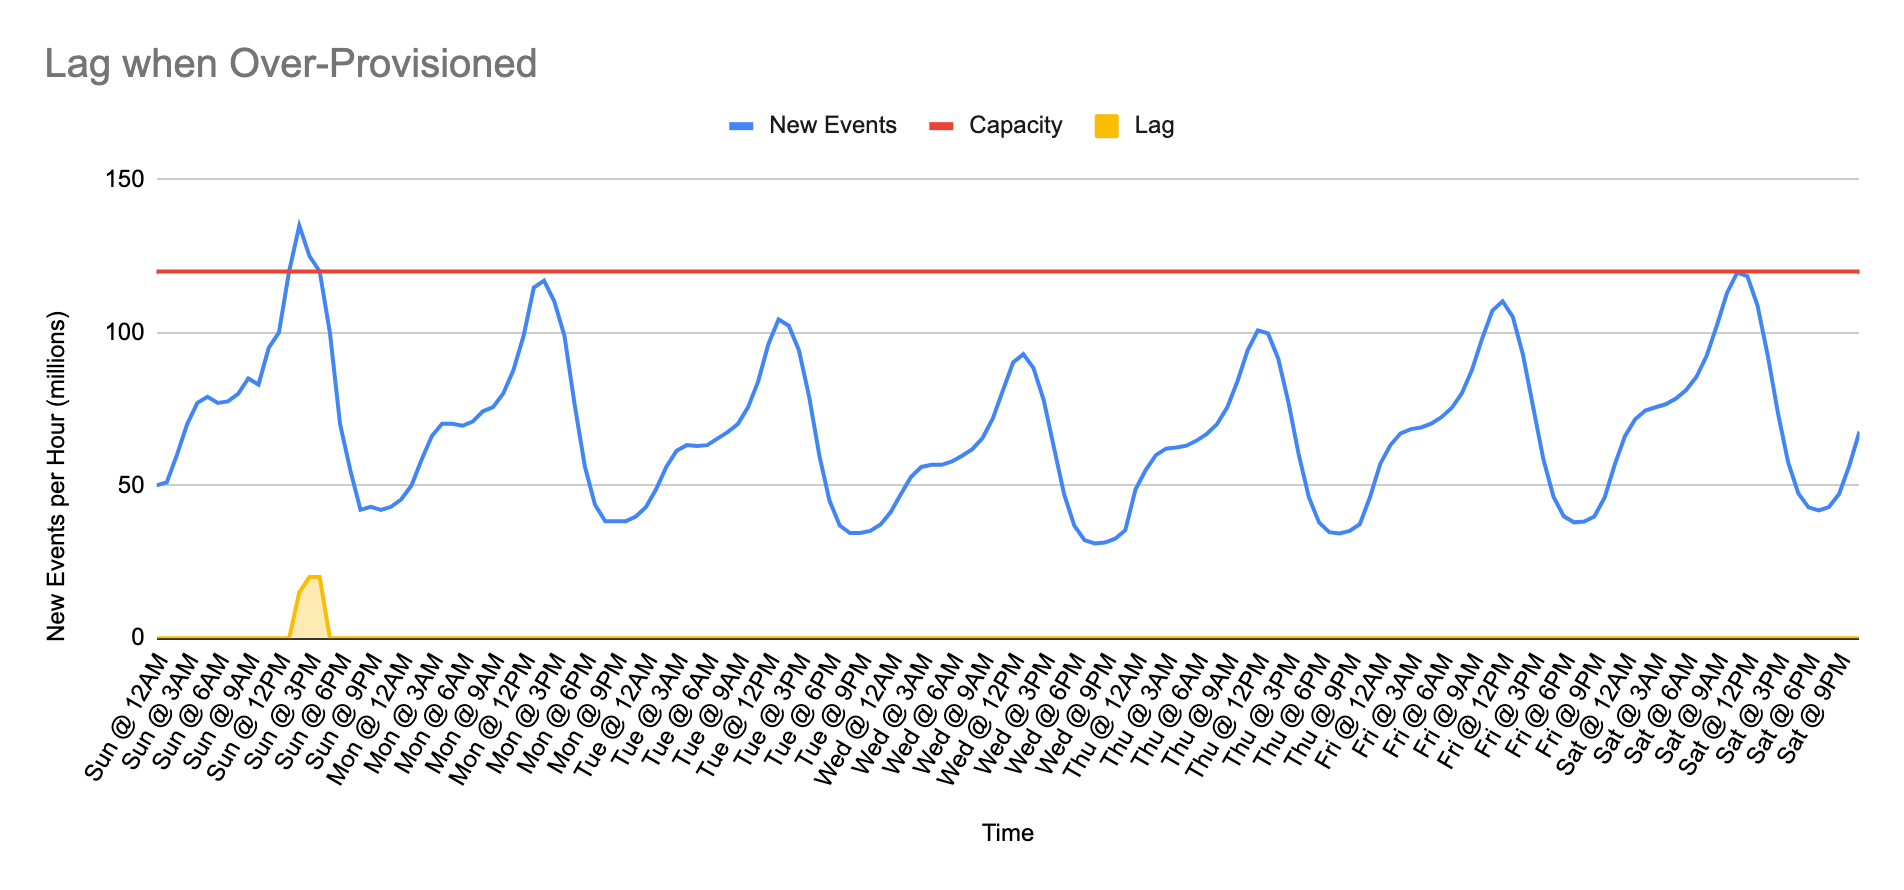
In order to minimize lag during peaks, one option is to overprovision resources. Given the same event arrival pattern, if we overprovision resources and therefore create significant surplus capacity that is always or almost always above demand, then lag will not accumulate or it will accumulate very little (as seen in the chart above).
Prior to the Apache Druid 0.22 release, those were the available options when using the Kafka or Kinesis Indexing Service; the taskCount parameter in the Supervisor configuration controls how many subtasks are assigned to the ingestion stream and therefore define max parallel capacity. Changing the taskCount required a manual process, so there was really only one choice to deliver consistent performance: overprovision and maybe over-overprovision manually for known periods of very high traffic such as Black Friday or Cyber Monday.
Dynamic Scaling
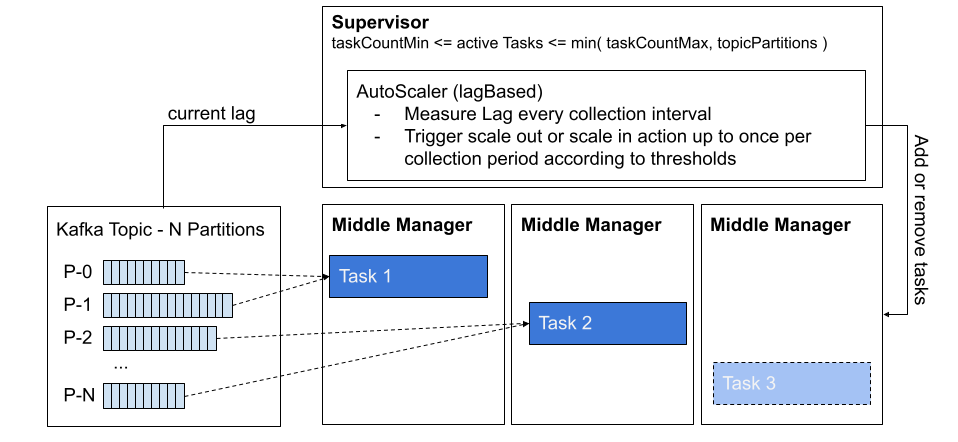
With Yue Zhang’s recent contribution to the 0.22 release of Apache Druid, there is a better way to handle the variable demand: it’s called the Task Autoscaler. This new feature can automatically increase and decrease the active subtasks that are processing a streaming ingestion. The framework allows one to control the minimum (taskCountMin) and maximum number of tasks (taskCountMax), how often task count adjustments can be performed (minTriggerScaleActionFrequencyMillis),and which strategy is used to determine when to scale up or down and by how much (autoScalerStrategy). In this initial feature PR, Yue provides a lagBased strategy to control automatic scaling.
The lag based auto scaler will measure lag as the number of pending messages in the queue. It takes this measurement every 30 seconds (lagCollectionIntervalMillis) and will take multiple measurements during a collection period of 10 minutes (lagCollectionRangeMillis).
If more than 30% (triggerScaleOutFractionThreshold) of lag measurements are above the scaleOutThreshold during a collection period, then a scale out event is triggered.
If more than 90% (triggerScaleInFractionThreshold) of lag measurements are below the scaleInThreshold during a collection period, then a scale in event is triggered.
Scale out or scale in events are only executed if enough time (minTriggerScaleActionFrequencyMillis) has passed since the last task count change occurred, otherwise they are ignored. When the scale out or scale in event is performed, the number of tasks are increased or decreased according to the corresponding scaleOutStep and scaleInStep parameters while respecting the limits defined by taskCountMax and taskCountMin respectively.
Example of Autoscaling Streaming Ingestion Configuration
The documentation on auto scaling points out that scale out (taskCountMax) will only increase tasks up to the number of partitions or shards available in the topic or stream. This makes sense because each partition is processed by a given task, so any tasks beyond the number of partitions would not have any work to do.
Auto Scaler Results
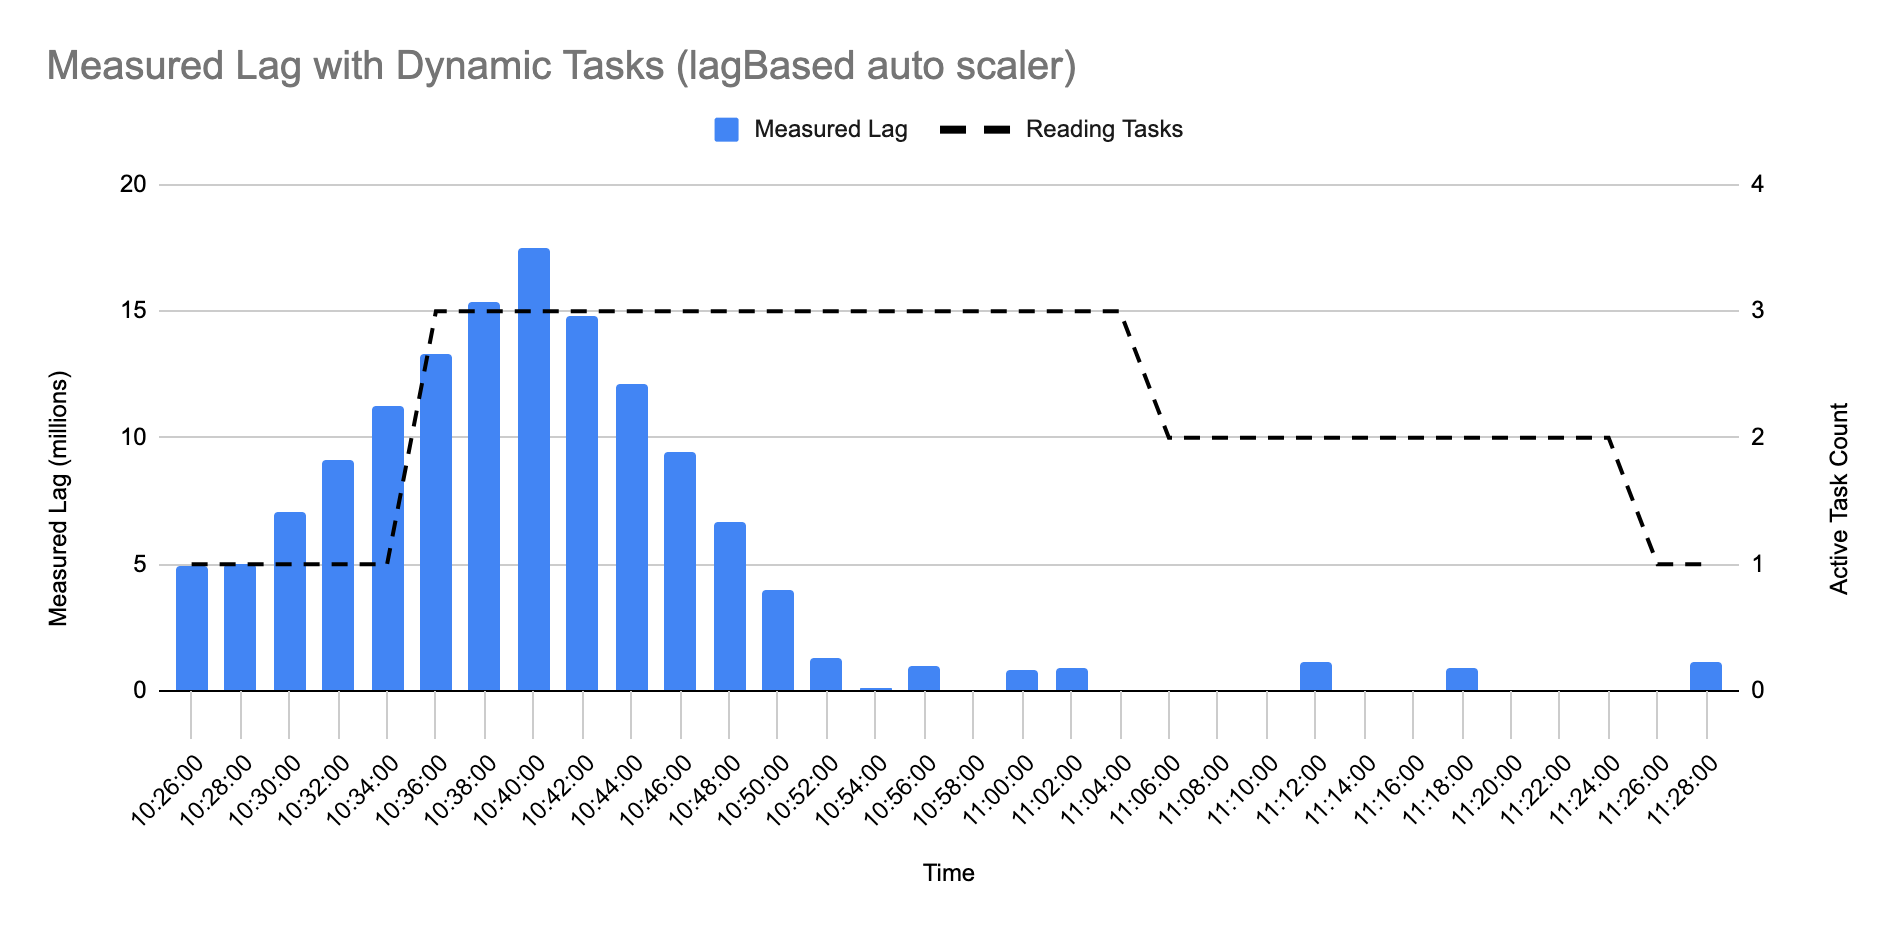
The following chart shows how the lagBased auto scaler behaves and how it keeps lag under control. As lag hits the scale out thresholds, tasks increase, more parallelism allows the ingestion to quickly catch up and as lag subsides, tasks are removed, releasing resources and continuing to maintain performance.
In the auto scale test shown in the chart above, task count increases by 2 when the first 10 minute measurement period (ending at 10:36) reports more than 30% of its measurements over the 6 million threshold. Capacity increases to 3x, consumption occurs faster and brings down lag. The second 10 minute period does not yet fit scale-in criteria so tasks remain unchanged. By the third 10 minute period, lag is more than 90% under 1 million, so task count is reduced by 1. Another 10 minutes pass and lag continues to be low, so another task is removed returning to the minimum count of 1.
Conclusion
Uneven traffic flow in streaming pipelines is a common problem. Providing the right level of resources to keep up with spikes in demand is a requirement in order to deliver timely analytics. Using a fixed set of tasks to process such a stream is either inadequate or too costly. Automatic scaling provides a tool to fine tune resource allocation dynamically as data flow increases and decreases. A big “Thank you!” to Yue Zhang for such a valuable contribution!
Other blogs you might find interesting
No records found...
Jun 16, 2026
Splunk Smartstore vs Lumi Loglake: Two Very Different Ways to Search Logs in Object Storage
One copies data back before it can be searched. The other queries it where it lives. Lumi Loglake lets Splunk teams query logs directly in object storage, including AWS S3, Delta Lake, Apache Iceberg, using...
Supercharging Schema-On-Read: Logs in Object Storage Don’t Need a Data Catalog
Machine data architectures are rapidly changing. As telemetry volumes continue to grow and as costs rise, organizations are increasingly moving logs and other machine data into object stores such as AWS S3....
Imply Lumi Loglake vs Splunk Federated Search for S3
Teams are increasingly moving log data into AWS S3 to reduce costs and extend retention. Both Lumi Loglake and Splunk Federated Search to S3 help you query data in AWS S3 to lower costs, however the two technologies...