The focus of this release, which includes includes Druid 0.12.1 is on improving the ability to analyze and understand variations in the data.
The main features of this release are:
Time compares
Download all
Advanced aggregation measures
Miscellaneous performance and stability improvements
Time compares
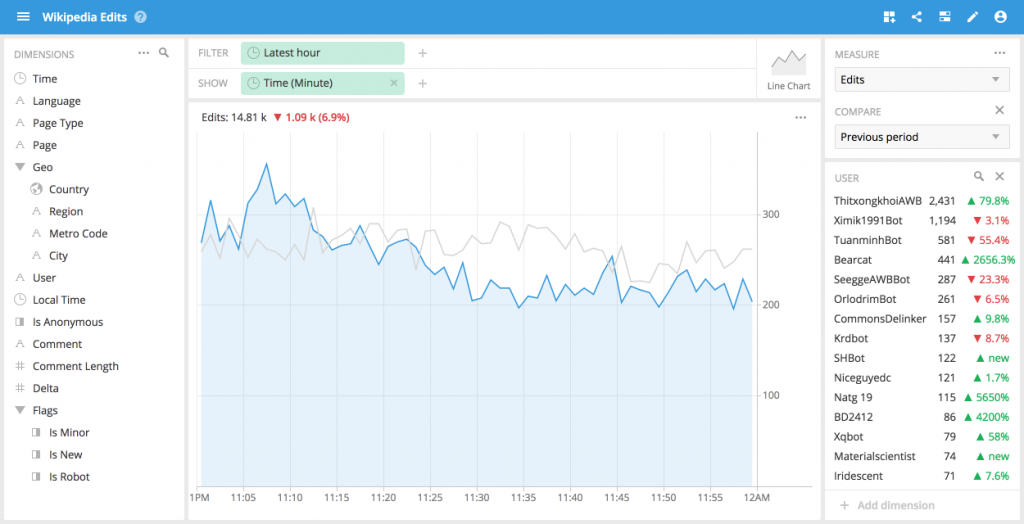
One use case that users express again and again is the desire to explore and manipulate the data but also to have historical context to guide that exploration. With Imply 2.6, the ability to compare with different time frames is now available.
You can now select a reference time period to compare against and all of your measures will be augmented with delta indicators visualizing their change. In the image above, the light gray line is the historical which provides useful context to the blue line, which is the time period being analyzed.
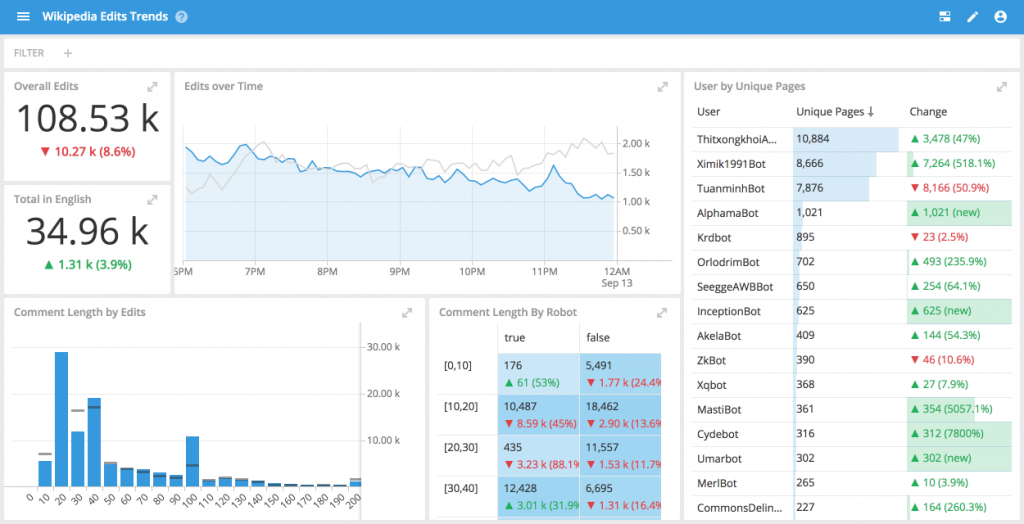
The time compare augmented visualizations can be composed into dashboards allowing you to get a quick overview of your relative performance.
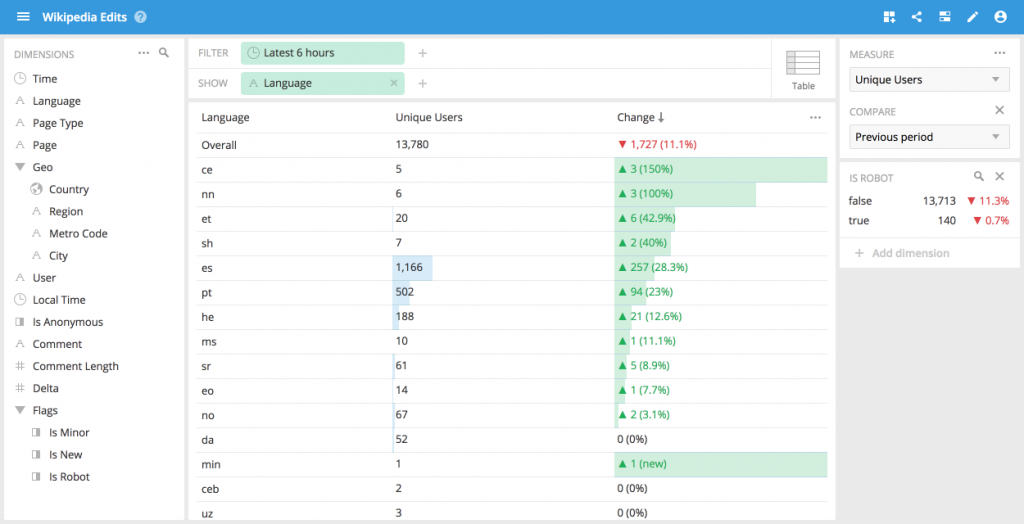
Furthermore, it is possible to sort on the data by the delta change column which, in one click, would bring the the biggest movers in a given measure to the top of the view allowing you to see which values changed the most.
Sometimes it is useful to look at the data in another application (most often Microsoft Excel). Once you find the precise slice of data you were looking for it is important to be able to get the results that you need in the right format.
With this release, the data comprising the results can be delivered in CSV, TSV, Excel, and JSON formats. Moreover, it is possible to pick the number of rows that you want to get back, up to and including all the rows for a dimension.
We have added the ability to express an internal regrouping within a measures aggregation. This enables advanced use-cases such as computing daily active users or computing 5 minutely 95th percentiles that are commonly used for burstable billing in the netflow world.
Try it today
Imply 2.6 is available today Stay tuned for even more features for Druid and Imply.
Other blogs you might find interesting
No records found...
Jul 23, 2024
Streamlining Time Series Analysis with Imply Polaris
We are excited to share the latest enhancements in Imply Polaris, introducing time series analysis to revolutionize your analytics capabilities across vast amounts of data in real time.
Transform your data management with upserts in Imply Polaris! Ensure data consistency and supercharge efficiency by seamlessly combining insert and update operations into one powerful action. Discover how Polaris’s...