Apache Druid has become a go-to solution for real-time analytics, enabling lightning-fast queries on constantly flowing data. But optimizing Druid for peak performance and high concurrency isn’t a one-size-fits-all affair. It’s about understanding the subtle dynamics between configuration settings, data ingestion, and query patterns.
In this article, we’ll guide you through the process of tuning your Druid real-time tasks for unparalleled query performance and concurrency.
A quick TL;DR
- Increase druid.indexer.fork.property.druid.processing.numThreads or increase replica
- Usually, it’s cleaner to increase replica, but the number of replicas cannot be more than the number of data nodes. Further, more replicas require more worker slots while increasing numThreads doesn’t require worker slots.
- Decrease intermediatePersistPeriod or decrease maxRowsInMemory
- Usually it’s a better idea to decrease maxRowsInMemory because decreasing intermediatePersistPeriod may result in smaller segments and make persist happens more often regardless of how many rows there are.
- Watch for mergeBuffer contention from concurrent groupBy queries
- Align your Kafka partition key with your Druid dimension sort order and secondary partitioning
- Enable peon cache with druid.realtime.cache and druid.realtime.cache.populateCache
Hopefully by the time we’re finished, these things will all make sense!
Which situations require enhanced tuning for real-time tasks?
In the age of instant gratification, users expect real-time access to data, and often these applications require high concurrency. Think live, consumer-facing IoT applications, stock tickers or sports betting platforms. In these scenarios where Druid is on the front line powering analytics applications, we need to spend some time tuning our ingestion tasks to do more than just consume data—they need to respond to lots of queries quickly.
How do you determine if your application needs enhanced tuning?
High concurrency: Hundreds or even thousands of users might be accessing their data simultaneously. The system must handle this load gracefully, without slowdowns or errors.
Real-time updates: Data must be constantly updated and reflected to users with minimal latency.
In an example IoT application, Druid is ingesting data from renewable energy generation sites like solar arrays. As conditions change throughout the day, consumers using these devices can view a dashboard and understand the energy they are generating. Based on the results, they can potentially change their energy utilization behavior. Make hay while the sun shines!
Why would we need to alter the tuning of Druid for these particular scenarios?
The default tuning of Druid ingestion tasks is focussed on exactly that—ingestion. The goal here is to ingest data at real-time speed while making the most efficient use of system resources.
For scenarios with high query concurrency, like driving real-time dashboards for thousands, careful tuning unlocks the full potential of the system.
Architecture refresh
Let’s start with a quick refresher on the overall Druid architecture.
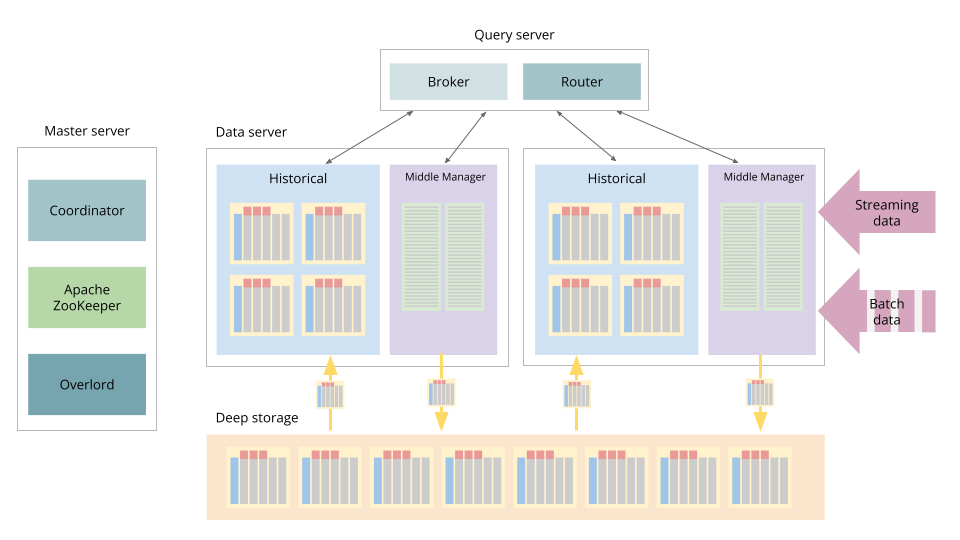
Figure 1: Druid Architecture.
For the purposes of this article, we will zoom in on the Middle Manager and its peons – the set of processes responsible for ingestion
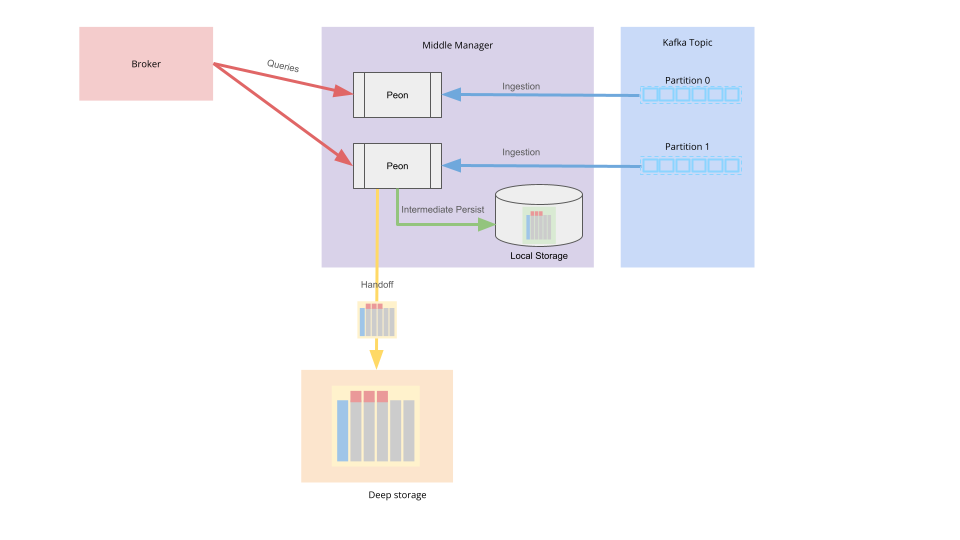
Figure 2: The Druid Architecture—with a focus on ingestion.
Let’s get tuning
Unleashing the Power of Processing Threads
Historical processes are often tuned to use the maximum number of processing threads available on an instance using the druid.processing.numThreads parameter. For peon processes, we might want to do the same. For this, we can use the equivalent parameter druid.indexer.fork.property.druid.processing.numThreads to increase the number of threads per peon. As the number of concurrent queries increases, so does the number of threads required to respond to the workload. This can be increased up to the number of cores – 1.
When setting this parameter, we need to keep in mind that we might have multiple peon processes on an instance depending on the configuration of druid.worker.capacity. Oversubscription here can result in decreased performance, so pay attention to the allocated threads and monitor changes in context switching when modifying this.
When in-memory is not faster
Data in Druid is stored in a columnar format for fast reads. Data read into Druid from Kafka is read in row format. At some point, the row-oriented data needs to become column-oriented data—this happens when we persist ingested data to disk.
In situations where we need to respond to queries on recently ingested data, we need the data to be optimized for queries as soon as possible. The intermediate persist activity not only converts the data to columnar format, it also completes the rollup of intermediate data and builds column indexes. These intermediate persists are stored on the local disk of the instance as shown in the diagram above
While the defaults for this intermediatePersistPeriod are 10 minutes (PT10M), reducing this to a lower value like 1 minute (PT1M) makes our optimized data available for fast querying earlier, improving the response time of our queries and our application.
While it may seem counterintuitive to choose to read data from disk instead of memory, this optimized format more than makes up for it. There is also the fact that the data is actually likely to still be in memory—but now instead of the Java heap, it is in the filesystem cache.
With every tuning choice, there may be some downsides. When decreasing the intermediatePersistPeriod, we will have more files to assemble when finished with the segment. Monitor ingestion logs for the timeline and messages related to this activity.
GroupBy queries require special consideration
GroupBy queries are a powerful feature in Apache Druid, allowing you to analyze and aggregate data across various dimensions. Understanding how they work using merge buffers is crucial for optimizing performance and resource utilization. These queries group data based on specified dimensions (e.g., user ID, time range, location) and aggregate values within each group (e.g., sum of purchases, average click-through rate).
Merge buffers are off-heap memory buffers used by the query processes (including the peons) for efficient merging of intermediate results from GroupBy queries. Each buffer acts as a temporary storage space for partially aggregated data from various segments.
Why are Merge Buffers Important?
They improve query performance by avoiding on-heap merging, which can be memory intensive for large datasets. They allow concurrent execution of multiple GroupBy queries by dedicating separate buffers for each.
The number of merge buffers needed depends on various factors, including query complexity, nesting depth, and expected concurrent query load. Insufficient merge buffers can lead to performance bottlenecks impacting query speed.
If your application uses groupBy queries, it is important that enough merge buffers are available to respond to the query workload without contention (waiting for a free buffer). Consider increasing druid.indexer.fork.property.druid.processing.numMergeBuffers to provide each peon with more merge buffers. The downside of increasing this value is each peon will consume more direct memory.
Consider the formula: Total Peon memory = Peon Heap + ((druid.processing.numThreads + druid.processing.numMergeBuffers + 1) * druid.processing.buffer.sizeBytes )
As an example, a Peon with 4GB heap, 8 processing threads, and 8 merge buffers of 300MB size will require: 4 + ((8 + 8 + 1) * 0.3) = 6.7GB of memory.
I’m a model, you know what I mean?
Druid secondary partitioning, dimension sort order, and Kafka partition keys can work together to ensure data is well grouped together right at the point of ingestion.
When we choose a well-thought-out Kafka partition key, we begin the journey of Druid rollup and aggregation as early as possible. Data will be grouped together in the Peon as it is ingested from Kafka and aggregated ASAP. This helps us store data efficiently in the first instance.
Data in Druid is sorted according to the order of dimensions in the ingestion spec / supervisor spec. By specifying dimensions we most frequently filter on first, we can ensure that the data we are querying is well grouped together for efficient query responses.
Secondary partitioning dimensions, while not essential for real-time queries, are another factor to consider. These should also correspond to our query patterns and filters for efficient querying after compaction has occurred.
By aligning Kafka partition keys, dimension sort order and secondary partitioning, we can shoot for the stars!
Peons can cache
There are a few layers of cache in a Druid system including on-heap cache, filesystem cache and segment cache.
By default the on-heap cache for peon processes is not configured – it makes sense in our journey towards high performance and high concurrency we should enable caching if we have the memory for it. A configuration such as
druid.realtime.cache.useCache=true
druid.realtime.cache.populateCache=true
druid.cache.sizeInBytes=400000000
could go a long way towards optimizing our performance.
Remember, tuning is an iterative process. Constantly monitor your Druid cluster’s performance metrics and adjust configurations as needed based on your query patterns and data volume.
By mastering these optimization techniques, you can transform your Apache Druid real-time tasks into blazing-fast engines for insightful analytics, handling high concurrency with ease. Go forth and conquer the world of real-time data with your newly-tuned Druid beast!
By following these tips and tricks, you can unlock the full potential of Apache Druid and empower your data-driven decision making, one optimized query at a time.
For the easiest way to get started, sign up for a free trial of Imply Polaris, a fully managed Druid-as-a-service.
 Architecture
 Deployment
 Ingestion
 Modeling
 Operations
 Development


