We are seeing an increasing demand for real-time monitoring of data due to rapid development of Industry 4.0, connected vehicles, and use cases like asset tracking. Industries like automotive, energy, aerospace, and manufacturing send millions of daily messages from Internet of Things (IoT) devices to cloud services, and require real-time monitoring of this telemetry data.
Unlocking instantaneous insights from IoT telemetry data has resulted in enhanced visibility, automated decision-making, and reduced costs for numerous initiatives. However, most industries find it challenging to ingest and monitor data in real time due to architectural limitations on latency, concurrency, and scale. Finding real-time insights from IoT telemetry data can sometimes feel daunting, but the returns in business value and impact can be considerable.
In this blog post, we will explain the benefits of sending IoT device data from AWS IoT Core to Imply’s real-time monitoring and observability platform. We will also walk you through a step-by-step approach to using AWS IoT Core and Imply to build a real-time analytics application to help operators and other end users monitor, diagnose, and resolve production issues.
Imply
Imply is a managed version of Apache Druid—a time-series data storage and analysis engine with subsecond queries across data at scale. A combination of fast queries with high concurrency of real-time stream data with historical context ensures IoT applications have immediate access to all of the data needed to drive actionable insights.
AWS IoT Core
AWS IoT Core is a fully managed service that connects billions of IoT devices to AWS cloud, and routes trillions of messages from IoT devices to 15+ AWS and third-party cloud services.
Rules Engine
Rules Engine is a micro-service within AWS IoT Core that enables anyone to process, decode, and filter IoT messages at scale using SQL-like statements. Rules Engine also lets you define IoT Rule Actions to route your IoT device data to over 15 AWS and external services—and to any number of HTTP endpoints.
Why send IoT device data to Imply?
Imply is the easiest way to run fast analytics and fast aggregations of metrics emitted from sensors, a common use case across a multitude of industries. Examples include:
Networking and telecommunications
Router and firewall sensor companies use Imply to monitor, visualize, and trigger alters on telemetry data without the need for pre-processing and performing other computations that normally increase operational complexity.
Industrial
Manufacturing industries and processes use Imply to ingest, monitor, and analyze global, regional, and plant-level aggregated metrics from industrial sensors. These industries also use Imply to ensure real-time operational visibility of metric data and to monitor granular data as products are manufactured. Additionally, we are seeing manufacturing companies ingest data to Imply’s platform and train AI/ML model for predictive maintenance.
Logistics
Logistics and asset tracking companies use Imply to keep real-time track of distributed asset fleets across multiple uses. This minimizes downtime by flagging and resolving issues before they degrade operations. Further, monitoring the data in Imply enables logistics teams to analyze productivity by fleet size and visualize common trends across a global footprint.
Solution Overview
In this solution, we will describe how to route data from your IoT devices to Imply via AWS IoT Core. Imply’s capability to provide subsecond queries across data at scale, high concurrency, and a combination of real-time stream data with historical context ensures that IoT applications have immediate access to all of the data needed to drive actionable insights.
Prerequisites
To setup the solution described in this blog post, you will need:
- An AWS account in an AWS Region that supports AWS IoT Core and Amazon Kinesis Data Streams
- Permissions to create IoT Rules, AWS Identity and Access Management (IAM) roles and policies, and access to AWS CloudShell
- A Raspberry Pi or any IoT client/device that is connected to AWS IoT Core
- An Imply Polaris account

Step 1: Connect your IoT devices to AWS IoT Core
In this step, you will connect your IoT devices to AWS IoT Core by following the steps shown in AWS IoT Core’s developer guide. This requires you to set up your IoT policies, download the IoT certificates, create IoT Things, and attach your IoT Things and policies to the IoT certificates.
Step 2: Publish MQTT messages from your IoT device to AWS IoT Core
On completion of Step 1, you can start publishing MQTT messages from your IoT devices to AWS IoT Core. You can use the AWS IoT MQTT client to subscribe and view the MQTT messages in AWS IoT Core’s management console. For a step by step demo of Step 1 and Step 2, you can also refer to the video.
Step 3: Set up an IoT Rule and Action to route your IoT messages to Imply Polaris over HTTP(S)
Once AWS IoT Core’s MQTT Broker starts subscribing to the messages published by your IoT device, you can use AWS IoT Core’s Rules Engine to filter, process, and decode the IoT device data and to route the data to Imply Polaris via HTTP(S).
To set up an IoT Rule, follow the instructions in the developer guide. After creating your IoT Rule, route your IoT data to an Imply.io HTTPs endpoint using an HTTPs Action Rule in IoT Rules. For a hands-on demo on how to use IoT Rules and Rules Action, refer to this video. You can create a connector to send data directly to a table in Polaris using this guide.
Step 5: Build a monitoring dashboard in Imply
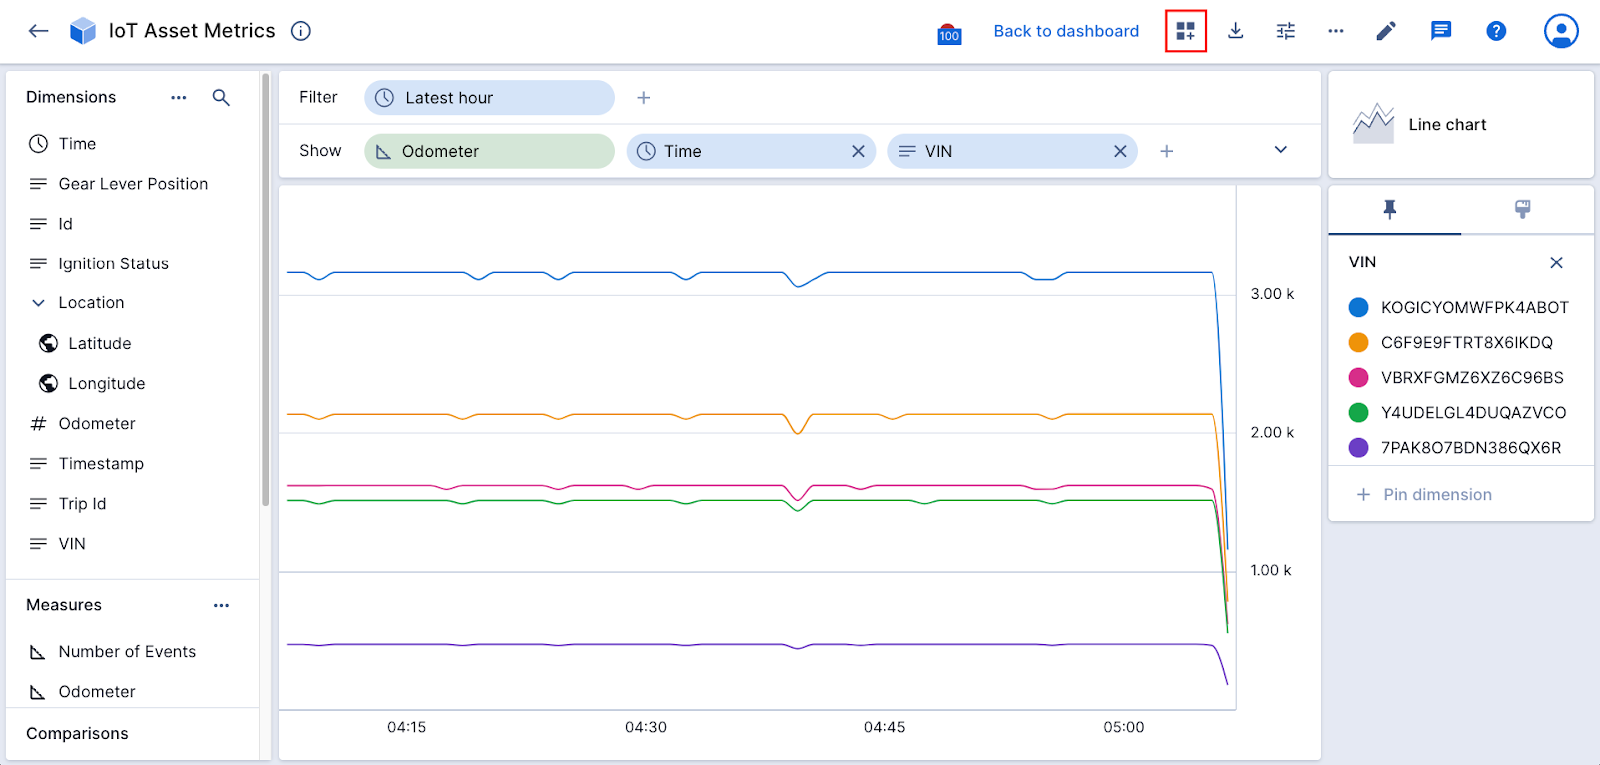
Now that you have some data being streamed into a table in Imply Polaris, you can quickly build some visualization and a dashboard to give you real-time visibility into your assets.
First, create a data cube which you can use to explore and visualize the data in the table that contains your event data from your asset. A data cube allows you to explore your data and visualize patterns in an instant at a high-level of granularity. Once you are satisfied with your first visualization, add it to a dashboard.
You can reference the same datacube you created earlier to add more visualization tiles to your dashboard. Now that you have built your first dashboard with analytics that provide real-time visibility, we can now think about taking this a step further by building a simple standalone application with this visualization.
Step 6: Embed visualizations with react and express
Imply also provides a set of simple tools to embed the IoT event dashboards and visualizations that you created earlier – directly into your application via an iFrame.
The following tutorial will walk you through how to create a very simple web application that shows a different embedded visualization relative to the user.
While this example is simple, it highlights the possibilities of how you can use Imply’s embedding features to quickly integrate critical IoT metrics and visualizations into your application workflow.
Conclusion
The above example shows how you can use AWS IoT Core and Imply together to ingest, monitor, and analyze real-time telemetry data from your IoT devices to a fully managed Apache Druid service, without worrying about provisioning or managing any cloud infrastructure.
Get started today with a free trial of Imply Polaris.
 Architecture
 Deployment
 Ingestion
 Modeling
 Operations
 Development


