How to Build a Sentiment Analysis Application with ChatGPT and Druid
May 21, 2023
Rick Jacobs
Overview
Like many in the developer community, I have tried ChatGPT from OpenAI. Over my IT career, I have worked in many positions including as a data scientist/data engineer. So, as I did my assessment of ChatGPT, I thought of ways to use the technology in practice. I have done sentiment analysis before using custom algorithms that I wrote, specific NLP (Natural Language Processing) libraries, and low-code platforms like Weka, RapidMiner, and DataRobot. Why not do something similar using ChatGPT and combine it with a real-time analytics database like Apache Druid?
There are many benefits to combining a trained, NLP model with Apache Druid for sentiment analysis. Modern models such as GPT-3 and GPT-4 are highly effective in understanding and processing natural language. They can better identify nuances and context, resulting in more accurate results. Sentiment analysis often requires processing large volumes of data, such as social media posts, reviews, or customer feedback. And then, aggregating and analyzing those sentiments at scale can reveal even more insights and identify patterns and trends – all crucial for businesses that need to react quickly to changes in customer sentiment.
As this blog will show, the integration is relatively easy using technologies that are publicly accessible.
Here is A Quick Summary of the Technologies
ChatGPT from OpenAI is a hot, trending topic these days. It is defined as a deep learning-based language model trained using a large corpus of text data. It uses unsupervised learning, contextual understanding, and probabilistic modeling techniques to generate human-like responses to natural language inputs. Developers can integrate ChatGPT into their applications to provide functionality like language translation, summarization, sentiment analysis, conversation generation, etc. to users.
Apache Druid is an open-source, high-performance, analytics database designed for real-time data analysis. Druid is designed to efficiently handle terabytes and petabytes of batch and streaming data while supporting thousands of concurrent users with low latency and high throughput that enable sub-second queries. Druid is designed to scale horizontally by adding more nodes to the cluster as the data size grows. It can store and query both historical and real-time data and offers flexible data ingestion options, allowing users to import data from a variety of sources, including Kafka, Kinesis, and hundreds of databases. It also supports advanced analytics features such as theta sketches (approximate distinct counting based on the Apache Data Sketches library), time series forecasting, and anomaly detection. Developers use Druid to build custom applications that require fast, real-time querying of large data sets.
Developers use Twitter APIs (Application Programming Interface) to access Twitter’s data and functionality programmatically. Twitter APIs provide a range of endpoints for accessing different types of data, including tweets, users, and trends. You can use the APIs to create custom applications that interact with Twitter’s platform, such as social media monitoring tools, sentiment analysis tools, and chatbots that operate in real-time.
Why Integrate ChatGPT and Druid?
Druid is designed to handle large volumes of data and can scale horizontally, as needed. Although it is purpose-built for streaming data, it can also ingest batch data, as I will describe later. In production environments, Druid is optimized to handle sub-second queries at scale, with high concurrency, low latency, and high throughput which results in lower cost with higher user satisfaction.
By using an AI tool like ChatGPT with Druid, you can perform sentiment analysis on massive datasets without compromising on query performance or accuracy. You could run ad-hoc aggregations and filters across different topics, populations, geographies, time ranges or 100s of other dimensions. Want to analyze your brand’s reputation by age group? Or want to see what percentage of your followers are sending positive or negative sentiments at any period of time? ChatGPT and Druid could empower businesses to make quick, data-driven decisions and respond to customer feedback or market trends in real-time. Druid makes visualization really easy too by seamlessly integrating with a variety of data visualization tools, including Apache Superset, Tableau, Power BI, Looker, QlickView, and Grafana.
Leveraging the strengths of both technologies, you can create robust solutions to tackle a range of AI analytical use cases, including:
Customer Feedback Analysis: the AI model can be used to analyze customer feedback on social media by performing sentiment analysis on tweets related to a particular brand, product, or service. This data can be streamed to Druid to allow data analysts to generate conclusions based on real-time information. The insights gained from this analysis can help organizations identify areas for improvement and address customer concerns.
Brand Monitoring: the AI model combined with Druid can be used to monitor the sentiment of tweets related to a brand, including mentions of the brand, competitors, or industry trends. This can help organizations stay on top of their brand reputation and respond to any negative sentiment.
Political Analysis: the AI model can be used to analyze tweets related to politics, including sentiment analysis of tweets related to political figures, events, and policies. These tweets can then be stored in Druid as streaming or batch data. Developers can then build analytical applications, and visualizations that provide insights into public opinion on political issues and help shape political messaging.
Social Media Marketing: the AI model can be used to analyze the sentiment of tweets related to social media marketing campaigns. By persisting the sentiments and original tweets in Druid, organizations identify which campaigns resonate with their target audience and adjust their marketing strategies accordingly.
Crisis Management: the AI model can be used to monitor the sentiment of tweets related to a crisis, such as a natural disaster or public health emergency. This data can be saved in Druid and used to create time series dashboards, predict things like which goods will be most needed and analyze problems like misinformation.
For this project, I will capture tweets using the Twitter API, determine the sentiments of the tweets using a ChatGPT model, save the tweets in Druid segments and then produce a chart to summarize the overall sentiments.
Prerequisites
The following prerequisites are required to execute this project.
Get Twitter API Credentials
The Twitter API allows developers to programmatically access Twitter data and functionality, such as searching for tweets, posting tweets, or retrieving user data. Follow similar steps below to obtain Twitter API credentials:
Apply for a developer account: Go to https://developer.twitter.com/en and apply for a developer account. You will need to fill out a form with your name, email, and a description of your intended use case for the Twitter API.
Verify your email address: Once you submit your application, you will receive an email from Twitter with a link to verify your email address. Click the link to confirm your email.
Create a Twitter app: After you verify your email address, log in to the Twitter Developer Dashboard and create a new app. Provide a name and description for your app, and select the use case that best matches your needs.
Set up app permissions: Once you create your app, you will need to set up permissions for your app to access the Twitter API. Depending on your use case, you may need to request additional permissions from Twitter.
Obtain API keys and access tokens: After you set up app permissions, Twitter will provide you with four credentials: API key, API secret key, access token, and access token secret. These credentials are necessary for you to authenticate and make requests to the Twitter API.
Use the Twitter API: Once you have your API keys and access tokens, you can use them to make requests to the Twitter API. Twitter provides documentation and code examples to help you get started.
Get OpenAI ChatGPT Key
OpenAI provides access to its language models, including GPT (Generative Pre-trained Transformer), through the OpenAI API. To use the API, you need to create an account with OpenAI and obtain an API key. This API key is a unique identifier that allows you to access the OpenAI API and use the language models in your applications. Follow the general steps below to obtain an OpenAI key:
Fill out the registration form with your email address, password, and other required information.
Verify your email address by clicking on the verification link sent to your email inbox.
Once you’ve verified your email address, log in to your OpenAI account.
Click on the “API Keys” tab.
Click the “New API Key” button.
Copy the API key provided.
Store the API key in a secure location.
Note that there may be fees associated with using the OpenAI API, depending on your usage and the specific features you need. You can find more information about the OpenAI API plans and pricing here.
Druid Installed and Running
If Druid is not installed, please refer to my previous blog for local installation instructions.
Let’s get started
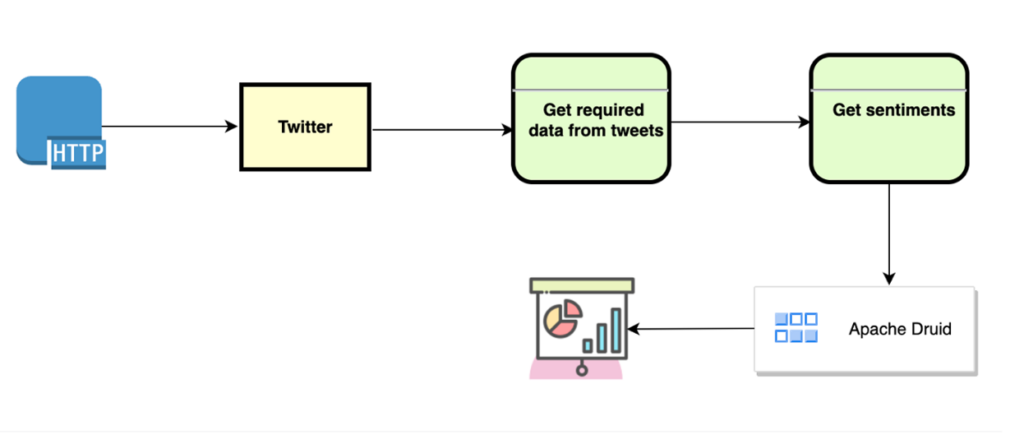
Below is a data flow diagram (DFD) of how data flows through this system:
Pipeline DFD
In a nutshell, the process starts by fetching Twitter data containing text “ChatGPT”. The data is then passed through sentiment analysis using ChatGPT to enhance it. The enhanced data is saved to Apache Druid. The program then connects to Druid and retrieves the enhanced Twitter data. The program counts the number of occurrences of each value in the column, stores the counts in a variable, and creates a pie chart using the aggregation. Finally, the pie chart is shown, and the process ends.
The data pipeline can be segmented into four specific actions. Each step is explained in greater detail below.
Step 1: Gather the data
Once you have secured the required Twitter credentials (see above), the next step is to connect to the Twitter API and retrieve tweets. This can be done in Python by using the tweepy library. The connection code should be similar to this with your specific authentication secrets and keys:
After executing the authentication and search actions you will have the number of tweets specified in a tweets object. From the tweets I pull out the following fields:
id
created_at
full_text
retweeted
At this point it’s time for step two.
Step 2: Get the Sentiments
Now it’s time to enhance the Twitter data with the NLP sentiment analysis from ChatGPT. After obtaining the ChatGPT key (see above), it’s possible to access the models via the OpenAI API. We will be using the text-davinci-003 model. It is an advanced natural language processing model developed by OpenAI. It is capable of generating human-like text responses and is trained on a large corpus of text data using deep neural networks, enabling it to understand context and generate responses in a natural, conversational way.
To use the model first import OpenAI. Then questions can be asked and responses returned using the code sample below:
I use the OpenAI API to ask questions of each tweet and then save the NLP responses. The table below gives sample questions I use to gather the AI generated sentiment information to make the tweet data more meaningful.
ChaptGPT Questions
Data Requested
Sample question
Sentiment
What is the sentiment of this statement?
Ranking
On a scale of 1 to 10, how positive or negative is this tweet?
Opinion
What is your opinion of this statement?
Profile
What is the profile of the person who would write this tweet?
Now that we have the tweets and their sentiment information. It’s time to store that data.
Step 3: Ingest Data
There are several ways to ingest data into Druid. I used a Python script to execute a command line instruction (see below).
This code uses the Python os library to execute the load instructions to load the data in the specified file and create indexes using a ‘bin/post-index-task’ utility that ships with Druid and the configuration file that I specified. Below is an example of the insert_config.json that I used.
In my analysis, I examined the tone of each tweet collected to gauge how users felt about the ChatGPT AI platform. This involved assessing whether the tweets conveyed positive, negative, or neutral opinions as determined by the AI model. I could have chosen any other topic and replaced the text filter used to retrieve the tweets (see code snippet below).
Python
if__name__ == "__main__": containing_text = "chatgpt" total_number_of_tweets = 100 language = "en" api = get_tweepy_api() get_tweets_containing_text(api, containing_text, total_number_of_tweets, language)
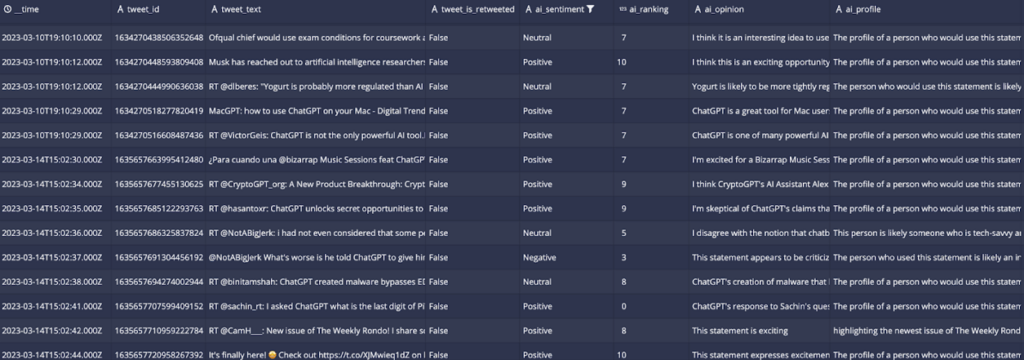
Here is an example of what the data looks like in the Druid UI:
Now it’s time to visualize the results.
Step 4: Plot the Distribution
To plot the data, I first connect to Druid using a library called pydruid with specific connection details for the Druid database, such as the host, port, path, and scheme. I then execute a SQL SELECT query to get the data. I load the results into a pandas DataFrame and count the number of occurrences of each value in the DataFrame column and store the results in a variable. Finally, I generate a pie chart using the counts data and displays it using the ‘plt.show()’ function from the matplotlib library. The resulting chart shows the proportion of each value in the ‘ai_sentiment’ column. Here is the sample code:
Python
# Druid connection detailsdruid_host = "localhost"druid_port = 8888druid_path = "/druid/v2/sql"druid_scheme = "http"# Query to retrieve data from Druiddruid_query = "SELECT ai_sentiment FROM tweets_sentiments_data WHERE ai_sentiment IS NOT NULL"# Connect to Druid and execute querydruid_connection = connect(host=druid_host, port=druid_port, path=druid_path, scheme=druid_scheme)druid_cursor = druid_connection.cursor()results = druid_cursor.execute(druid_query)# Convert query results to a Pandas DataFramedf = pd.DataFrame(druid_cursor.fetchall(), columns=[desc[0] for desc in druid_cursor.description])# Count the number of occurrences of each value in the columncounts = df['ai_sentiment'].value_counts()# Plot the counts as a pie chartcounts.plot(kind='pie')# Add a title to the chartplt.title('Summary of Sentiment Analysis')# Show the chartplt.show()
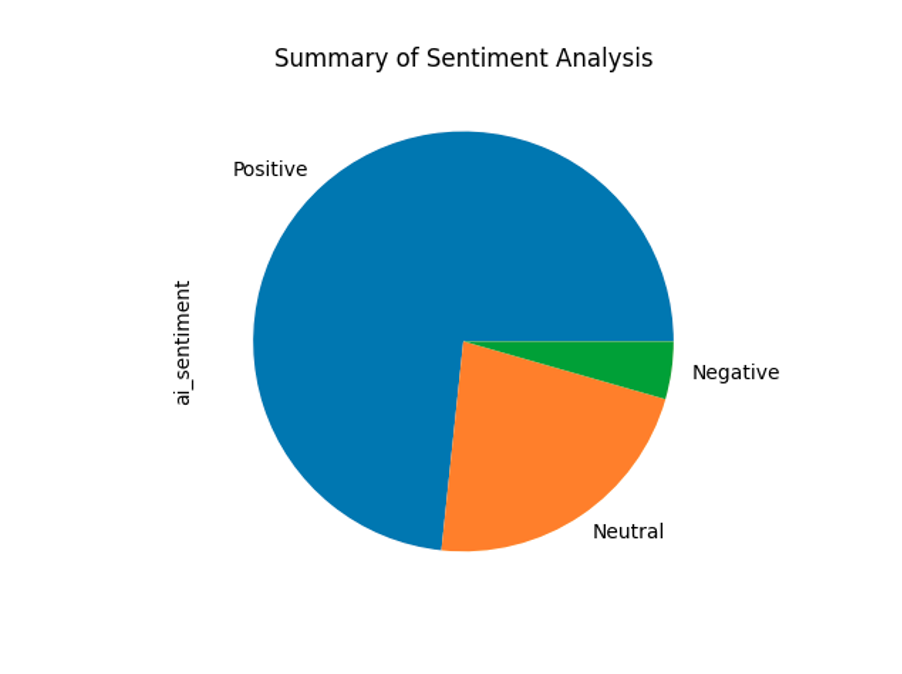
The resulting pie chart shows that the vast majority of the tweets about ‘ChatGPT’ are positive based on the NLP analysis of the OpenAI, ChatGPT text-davinci-003 model. For the tweets I analyzed, the sentiment was overwhelmingly positive. I suspect that will be the general tone of the ChatGPT-themed tweets for the near future. In that case, the graph will look similar to the one my data produced below:
I also executed a few queries from the Druid UI. For example, I was curious about sentiments that were highly positive. To get that information I used the following query:
Musk has reached out to artificial intelligence researchers in recent weeks to set up a new research lab to develop…
The opinion from AI was:
I think this is an exciting opportunity for AI researchers to further their work and potentially revolutionize the industry.
Here is one interesting result. Take a look at the profile of the person the text-davinci-003 model says would write the tweet:
The profile of a person who would use this statement is likely someone who is interested in technology and artificial intelligence.
It appears that the ChatGPT model is very impressed by the potential of AI.
Summary
To simplify this project, I only utilize a set number of tweets. But for a production sentiment analysis application, the tweets could be streamed to a messaging service like Kafka or Kinesis. The tweets could then be analyzed and the data enhanced using one of many sentiment analysis libraries such as:
Facebook: Facebook’s Graph API includes a sentiment analysis feature.
Python Natural Language Tool Kit: Sentiment analysis framework called VADER (Valence Aware Dictionary and sEntiment Reasoner).
In this blog, I showed how to address a use case where sentiment analysis is required for a specific data source. The same approach can be taken when dealing with other sources. Get the data, enhance the data with an AI model, save the data, and run analytics. Using Druid as the data store, these use cases can be addressed at scale using code for batch uploads or in real-time when sub-second analysis is required by thousands of concurrent users analyzing trillions of rows of data. The importance of Druid in this scenario is its ability to support fast analytical queries at scale.
A real-time environment is where Druid truly shines. It can connect to Kafka and Kinesis natively, so there is no need for a connector library or specific language-based SDK. Users can capture and augment data using various AI technologies as it is loaded into Druid then the data can be and then analyzed and visualized.
The fact is, AI systems are becoming a part of everyday life. The key is to ensure that these machines are aligned with human intentions and values. Please feel free to use the sample code included to create your own solutions and stay tuned for my upcoming articles.
About the Author
Rick Jacobs is a Senior Technical Product Marketing Manager at Imply. His varied background includes experience at IBM, Cloudera, and Couchbase. He has over 20 years of technology experience garnered from serving in development, consulting, data science, sales engineering, and other roles. He holds several academic degrees including an MS in Computational Science from George Mason University. When not working on technology, Rick is trying to learn Spanish and pursuing his dream of becoming a beach bum.
Other blogs you might find interesting
No records found...
Feb 25, 2026
Imply Lumi Product Preview: Removing the Cost–Performance Tradeoff in Observability
If you caught our recent product update, you’ve already seen the pace of development on Imply Lumi has been relentless. Last quarter, we delivered major performance and usability improvements to data...
Since releasing Imply Lumi in September 2025 as a decoupled data layer for observability, the Imply R&D team has been hard at work to make it easier and more economical to retain, query, and analyze observability...
The Most-Read Imply Blogs of 2025 (and what they signal for 2026)
Before we take on 2026, let’s rewind. 2025 was the year observability teams stopped asking, “How do we reduce data?” and started asking the real question: “How do we build an architecture that can keep...