In Imply 2.7 we have added a selection of new visualizations, as well as a new Explain feature that allows you to discover the contributing factors to any slice of data We are also introducing advanced user access controls, and several improvements to loading and managing data.
New Visualizations
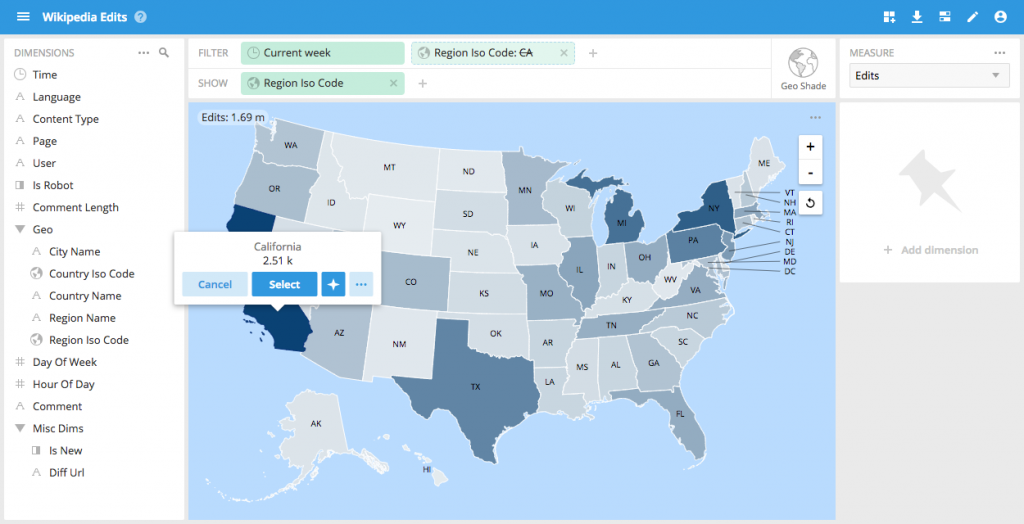
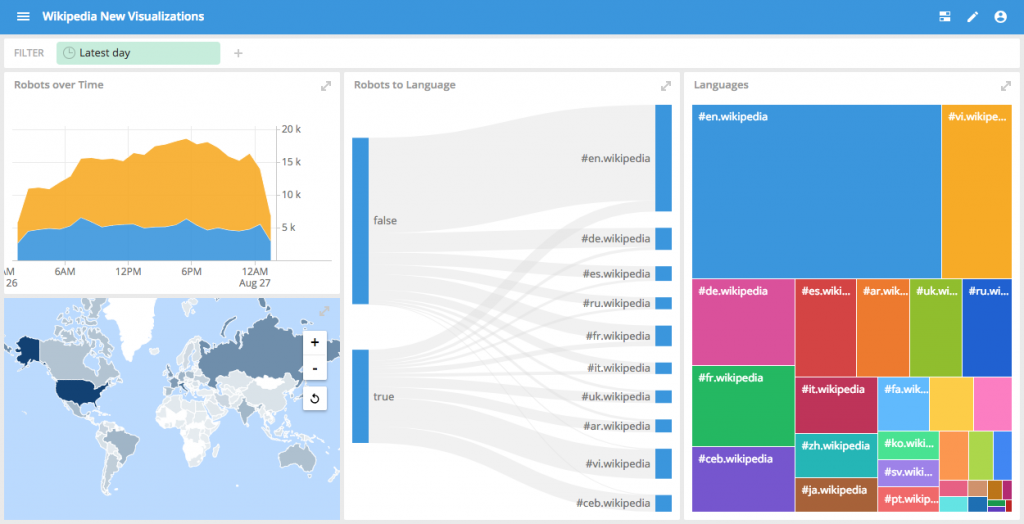
The new improvements to the geo visualization now allow for Geo Shade maps US state level data is also now supported.
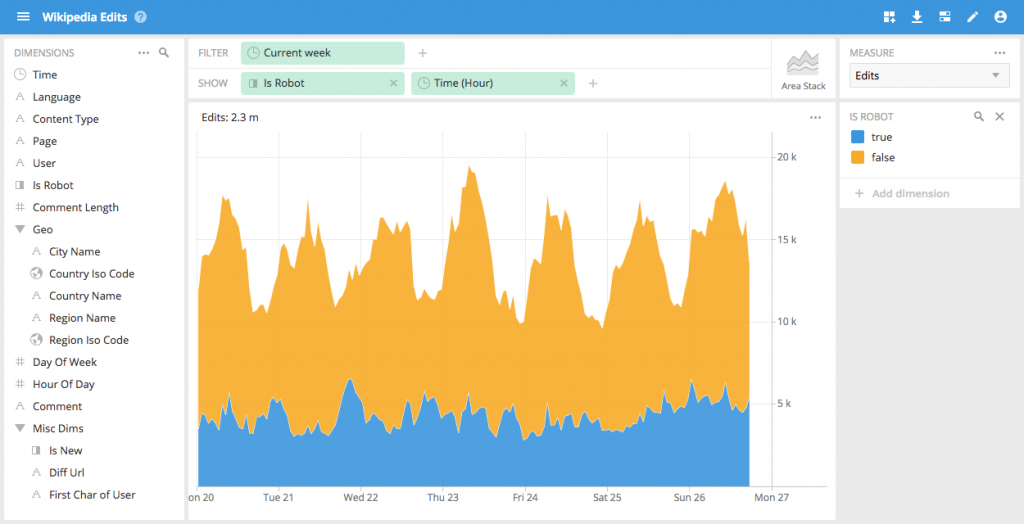
We’ve also added a stacked area chart that is useful to visualize overall fluctuation while also seeing the breakdown across a certain dimension.
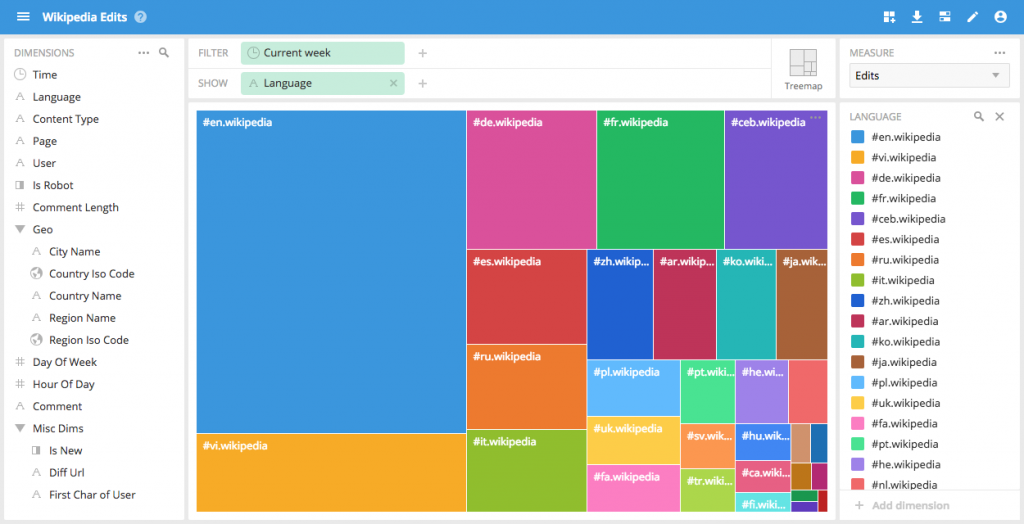
The treemap visualization provides an ability to see the relative ‘weighted’ breakdown of a dimension at a glance.
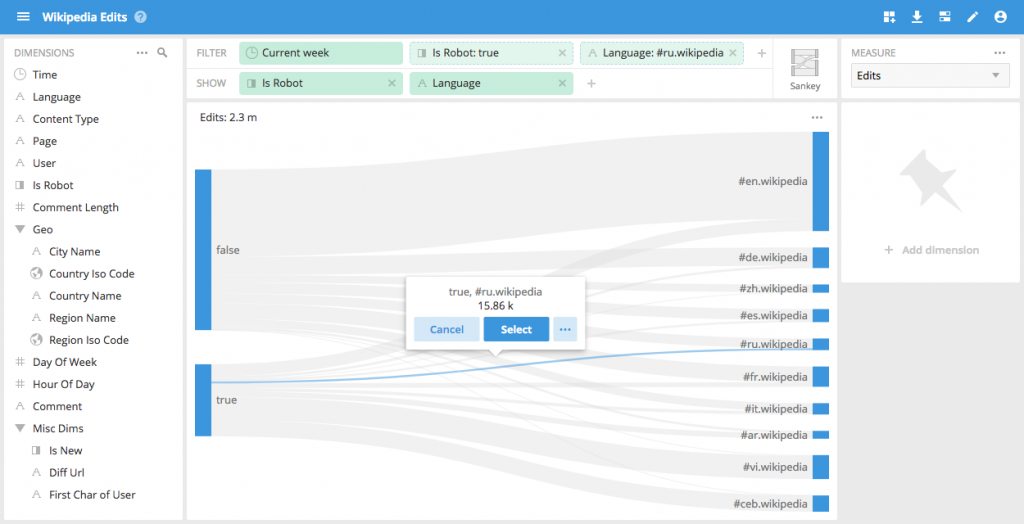
The Sankey diagram is great for showing a flow between two dimensions It is particularly useful when the data depicts an actual flow such as traffic in a network, or users on a website, but can also be applied to show a connection between any two dimensions.
Of course all of these visualization can be composed together into dashboards where they can be interactively explored with cross-filtering.
Explain
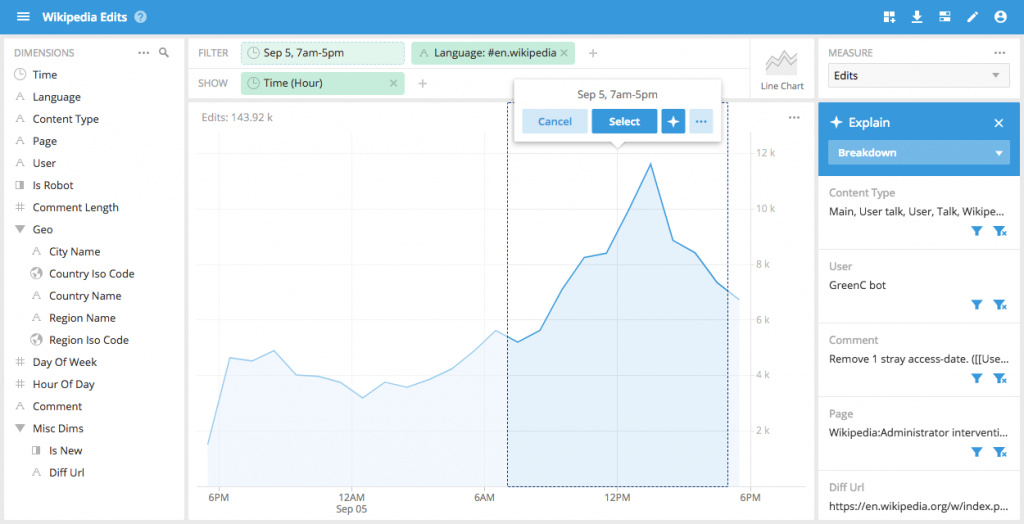
We are excited to introduce a new experimental feature to the Imply arsenal: Explain With Explain, you can select a slice of data that you are are interested in, click on the star button, and let our automated algorithms scan across all the dimensions of your data to figure out what has attributes have contributed most to the selected data Explain is useful to quickly understand the root cause of anomalies, or to understand why certain patterns and trends exist in your data.
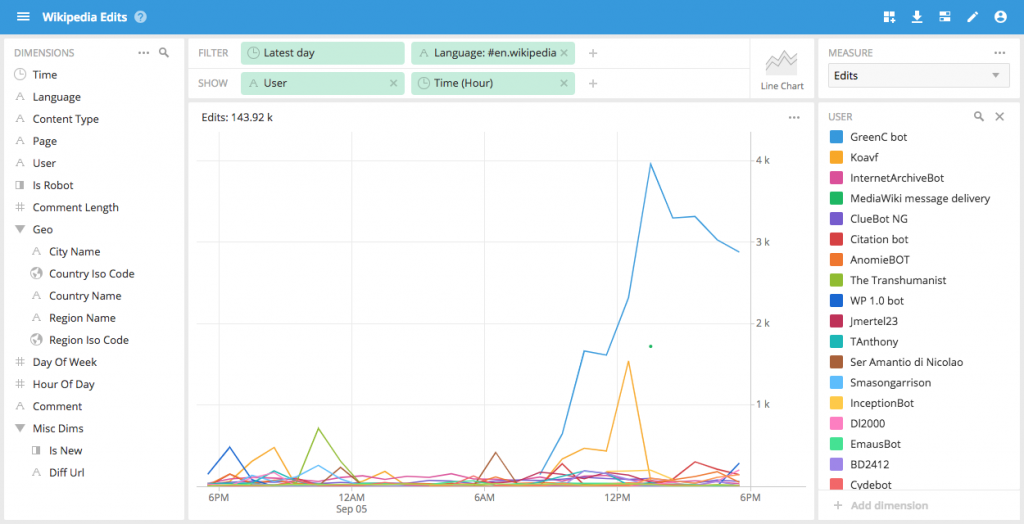
In the example above, we see that Explain has identified that user “GreenC bot” has been the driving contributor to the selected trend Adding the User dimension to the shown dimensions we can see why.
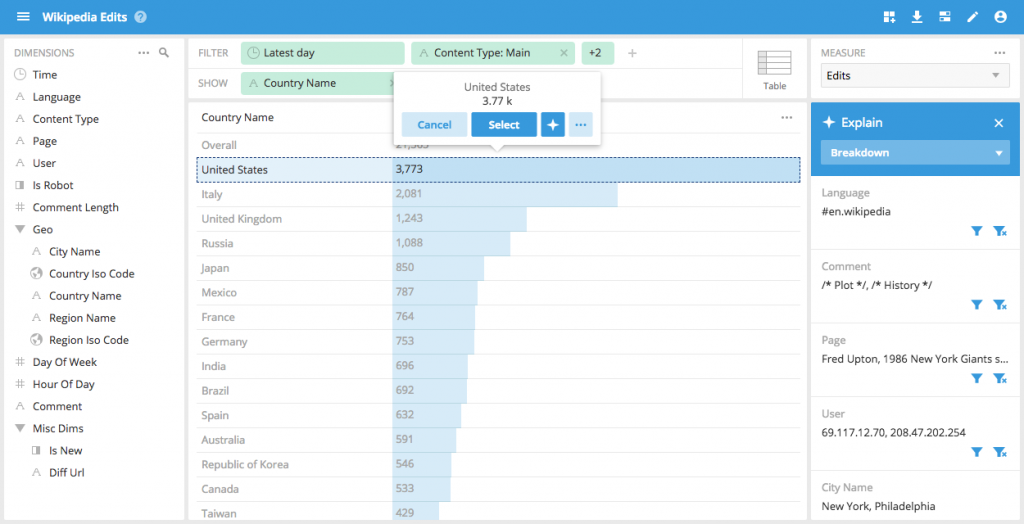
Explain is not limited to data changing over time You can select any slice of data and get a breakdown of the attributes that go into it In this case we can see, with one click, the users and pages that are driving these Wikipedia edits.
Explain is an experimental feature (you need to enable experimental features in the Settings in order to see it) but it has the potential to save you a significant amount of time in understanding data patterns We will continue to invest in this feature and improve it with each release We’d love to hear your feedback about the feature.
Access control and security
Imply 2.7 includes improvements to ensure that the right users at your organization have access to the right data,
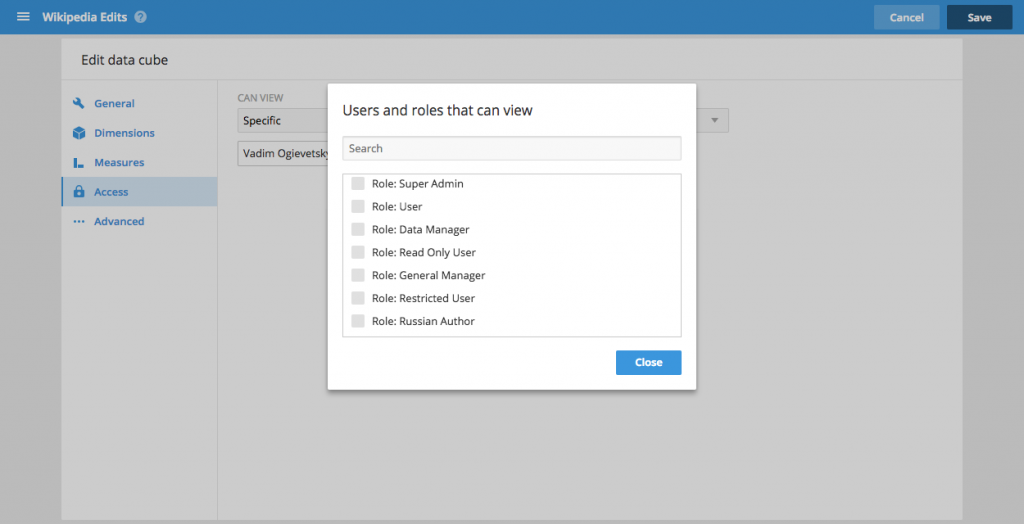
It is now possible to assign access controls to data cubes and dashboards on a role-by-role basis instead of just to specific users This allows for configuration of which roles have access to which views.
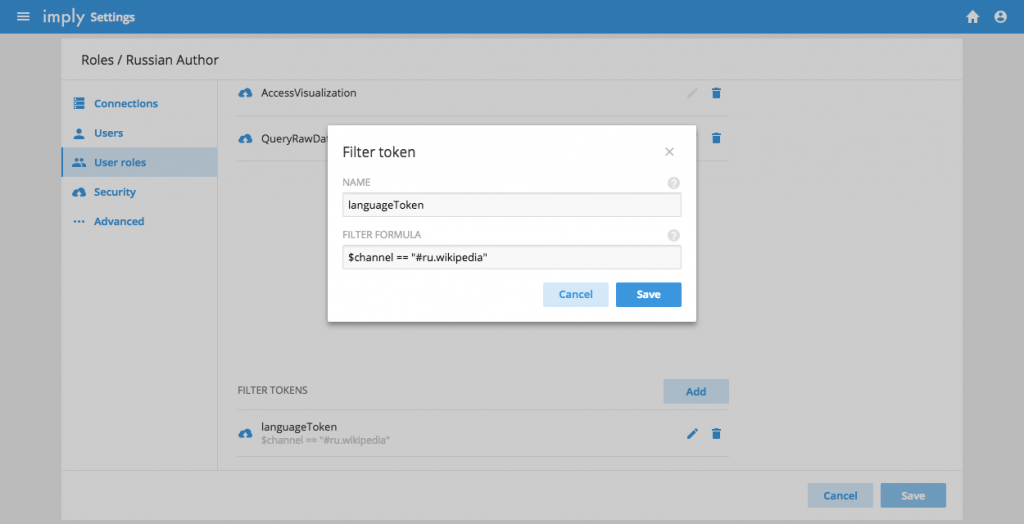
Furthermore, roles can now be configured to have ‘filter tokens’ that automatically enforce specific filters on data cubes This is an effective tool of restricting what data individual users (in certain roles) can see allowing you to configure different classes of users who all have access to the same data cube but see only the data that is relevant to them.
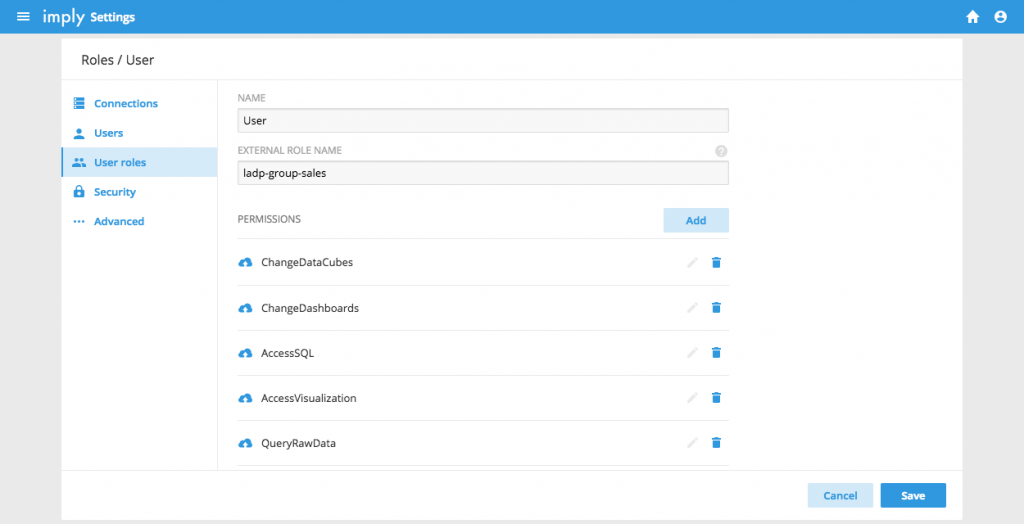
We have also greatly improved our integration with external identity providers (such as LDAP, Okta, e.t.c) and added a convenient way to map between external roles/groups to Imply’s roles.
In the example above the users logging in via LDAP with the LDAP group of “ldap-group-sales” will be mapped to the the Imply role of “User”.
Data management
This release includes a number of new features to simplify the process of ingesting and managing the data in Druid.
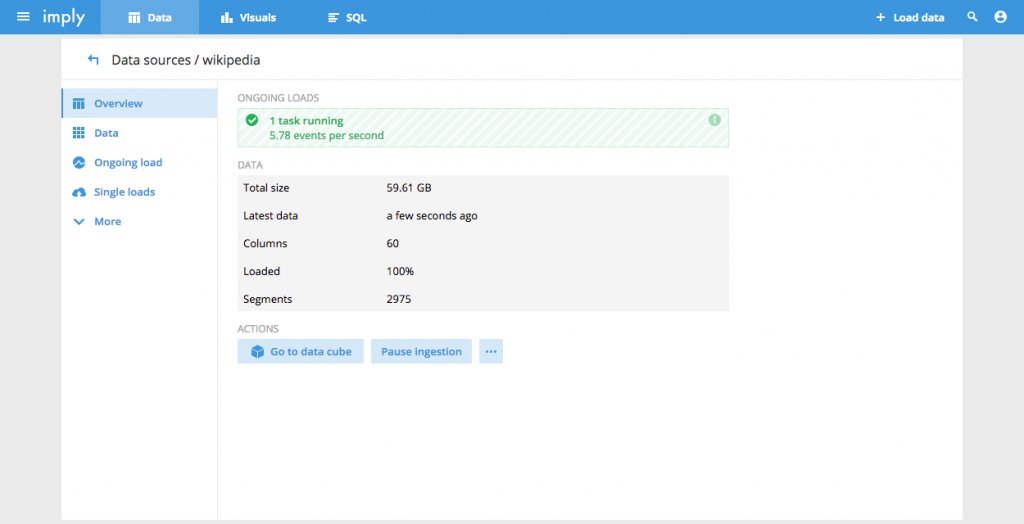
In the 2.7 release, detailed metrics are surfaced about the performance of real-time ingestion tasks so you can see the rate at which your data is being loaded.
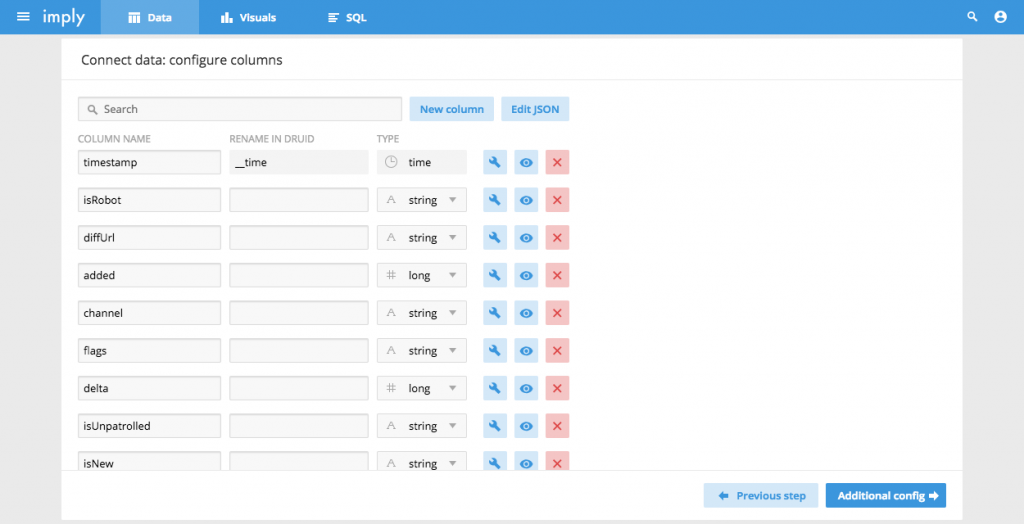
We have redesigned parts of the data loading flow to make it more intuitive for configuring your schema.
We have also greatly expanded the error reporting capabilities of the Druid ingestion system This means that if you have errors during the ingestion process, you will be able to see the cause of errors without having to dig through logs.
Miscellaneous
In addition to all we have described above, we have also made a lot of fixes to many parts of the platform including performance and stability improvements, and better customization support.
10 Years of Imply: From Apache Druid to What’s Next in Real-Time Analytics
We’ve officially hit double digits! Ten years ago, a few Druid-obsessed engineers asked a radical question: What if analytics didn’t have to be slow, stale, or stuck in dashboards? Back then, we were just...
Real-Time Observability Without Operational Overhead: What’s Next?
Observability is meant to provide clarity, speed, and confidence in modern systems. Yet for many organizations, it has become a source of complexity, cost, and operational drag. Managing pipelines, tuning...
It’s Time to Rethink Observability: The Event-Driven Future
Observability has evolved. Forward-looking teams are already moving beyond static dashboards and fragmented telemetry—treating all observability data as events and unlocking real-time insights across their...