Tutorial: An End-to-end Streaming Analytics Stack for Juniper Streaming Telemetry
May 23, 2019
Eric Graham
This is Part 3 of our ongoing series on using Imply for network telemetry data. Follow these links for Part 1 and Part 2.
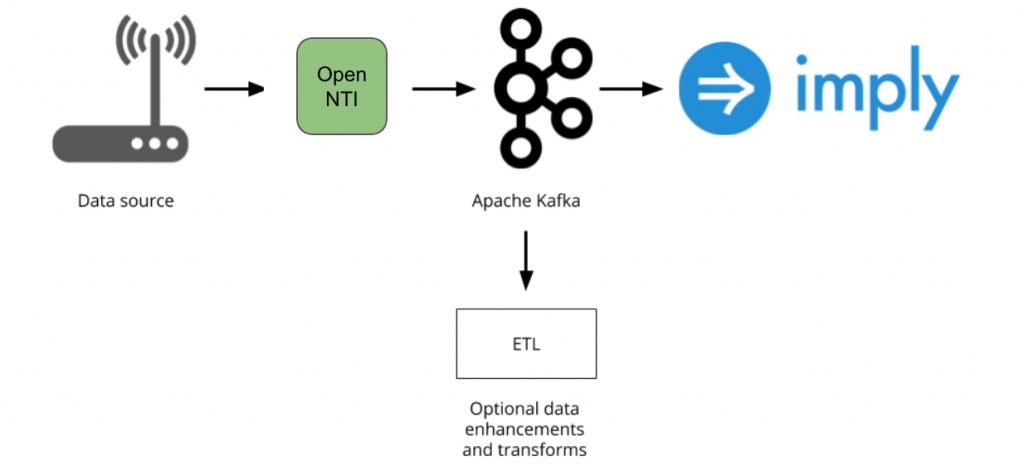
In this tutorial, we will step through how to set up Imply, Kafka, and Open-NTI to build an end-to-end streaming analytics stack that can handle Juniper Native streaming telemetry data. The setup described will use a single AWS instance for simplicity, but can be used as reference architecture for a fully distributed production deployment.
Modify conf-quickstart/druid/_common/common.runtime.properties with the right directories for segments and logs. If you have plenty of local disk you can keep the default configuration. A good reference is the Imply quickstart documentation: https://docs.imply.io/on-prem/quickstart
Start Imply from the Imply directory with the quickstart configuration by typing the following:
In the open-nti directory execute the following commands:
sudo make stop
sudo make start
Configure your Juniper router to send gpb over UDP to a destination address of the server you just setup. Send the streaming telemetry to destination port 50000.
Verify you are receiving streaming telemetry at the host, open-nti and Kafka.
On your open-nti host run tcpdump -i port 50000. You should see udp packets for your streaming telemetry.
To see if data is received at the open-nti container use the following command to check the opennti_input_jti log.
docker logs opennti_input_jti
You should see scrolling messages showing the json rom the streaming telemetry data.
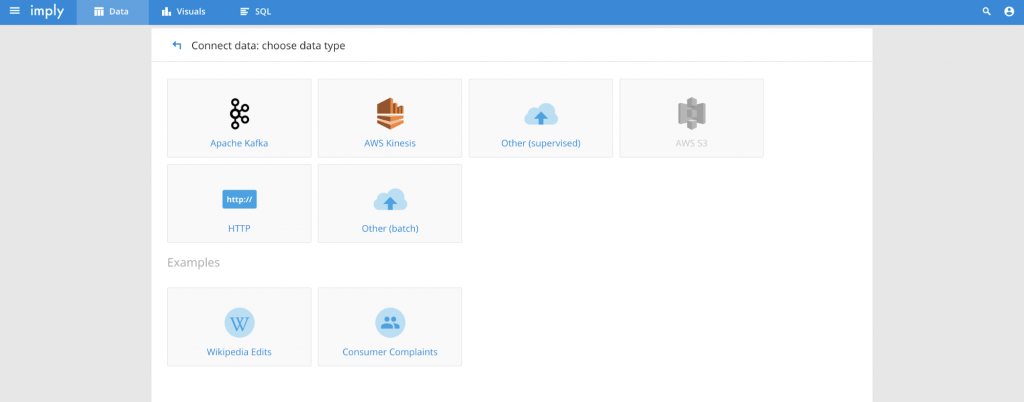
Start Imply by opening a browser and either going to localhost:9095 (if browser is being run from your localhost) or <public_ip:9095>. Remember to modify your security rules to allow destination port 9095 from your source IP. Select the Data/+Load Data (upper right), and the following options will be displayed.
Select the “Other (supervised)”.
Use this specification replacing the Kafka IP with your IP. This will help flatten the Juniper JSON so it can easily be imported into Druid. Also, this is for interface streaming telemetry only. Additional statistics are possible but they will need to be added to the specification file. Please contact us for help.
Select “Send”.
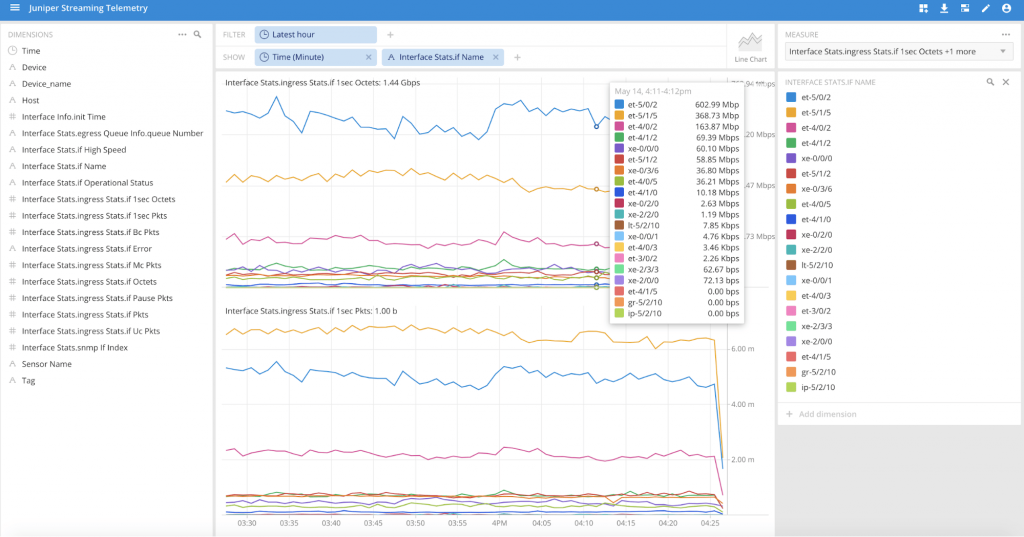
When your data is loaded you can now slice and dice your streaming telemetry data at amazing speeds.
Why You Shouldn’t Have to Delete Your VPC Flow Logs
When a security incident happens, investigators almost always start with the same questions: Which systems communicated? Where did the traffic originate? What changed before the incident? Was data exfiltrated?...
Splunk Smartstore vs Lumi Loglake: Two Very Different Ways to Search Logs in Object Storage
One copies data back before it can be searched. The other queries it where it lives. Lumi Loglake lets Splunk teams query logs directly in object storage, including AWS S3, Delta Lake, Apache Iceberg, using...
Supercharging Schema-On-Read: Logs in Object Storage Don’t Need a Data Catalog
Machine data architectures are rapidly changing. As telemetry volumes continue to grow and as costs rise, organizations are increasingly moving logs and other machine data into object stores such as AWS S3....