Deliver an interactive data experience
Start exploring even if you’re not sure what you’re looking for. Zoom in and out in an instant across datasets that have trillions of events. Maintain a birds-eye view with the flexibility to drill drown on granular details. Spot a trend? Slice and dice data through drag-and-drop fields make it easy to follow your instincts.
- Bring insights to life with point-and-click ad-hoc data exploration
- Explore fresh data with streaming data updates
- Be proactive with real-time dashboards, alerts, and monitoring
Extend insights to your customers with ease
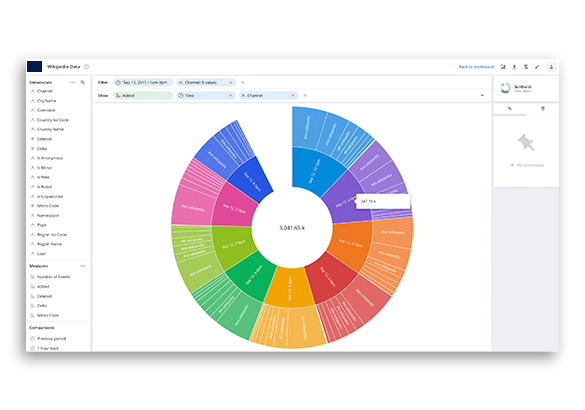
Free up development cycles with everything your team needs to share interactive insights under your brand. With a suite of fully customizable visualizations from starbursts to heatmaps, drag-and-drop simplicity, and white labeled branding, you can create interactive experiences exactly how you want to.
- Deliver a stunning and personalized customer experience
- Give your customers interactive insights for an optimal experience
- Reduce development cycles and speed time to market of your analytics application
Get Started with Imply
Intuitive Data Exploration
See the whole picture with Imply Pivot. And easily share visualizations with other team members, allowing you to explore the data together.
Learn More →

Build Powerful Applications
Accelerate the application development process. Create completely custom analytics applications in no time for immediate, flexible, and contextual exploration.
Learn More →
Enable Any Number of Users
Support more end users with up-to-the second views on data. Self-service, drag and drop analysis make it easy for anyone to explore and visualize data.
Learn More →
Learn More


