Apache Druid® is stable and self-healing. Once a cluster is running, it can automatically recover from most problems (see Providing High Availability and Disaster Recovery in Apache Druid® to be sure your cluster is ready for resilience!). While running Druid, though, there are a range of metrics that are useful to understand how the cluster is operating.
Monitoring Checklist
- Druid Metrics
- Choose Emitter
- Configure Endpoint
- Choose Logging Level
- Add Monitors
- Monitoring Infrastructure
Druid Metrics
By default, Druid does not emit metrics. If you want metrics, select a name for your metrics feed (this will appear as a JSON object in each metric emitted), then edit
_common/common.runtime.properties
and add
druid.request.logging.type=emitter
druid.request.logging.feed=<<FEED_NAME>>
… replacing <<FEED_NAME>> with your chosen feed name.
In the same file, choose an emitter type. The most common is JSON-over-HTML, but Log4j2 and other options are supported.
For HTTP, you’ll need to identify the endpoint where metrics will be sent. This should be a system that can ingest and analyze JSON logs:
druid.emitter=http
druid.emitter.http.recipientBaseUrl=http://<<LOG_ANALYZER>>:8080/path
… replacing <<LOG_ANALYZER>>:8080/path with the endpoint for your log analyzer.
The next choice is the level of detail you want emitted: from least information to most, you can choose from error, warn, info, or debug (the default is info). To change the metrics to the debug level, add the line:
druid.emitter.logging.logLevel=debug
Along with the standard metrics, you can also enable monitors to add additional metrics, providing deeper information about JVM, CPU, heartbeat, and other resource usage. The full list is under the Metrics monitors section of the Druid documentation.
To add a heartbeat monitor to your Druid cluster, add the line:
druid.monitoring.monitors=”org.apache.druid.server.metrics.ServiceStatusMonitor”
There are many metrics emitted by Druid, providing detailed data on queries, streaming, Java operation, ingestion, and more.
Monitoring Infrastructure
While Druid metrics provide detailed information about the internal operations of Druid, you’ll also need other tools to monitor the infrastructure you’re using, such as memory, storage, and network capacity.
This can be done with any infrastructure management tool, such as Datadog, Dynatrace, Solar Winds, Zabbix, or, if you’re running Druid on the Cloud, the tools offered by your Cloud provider.
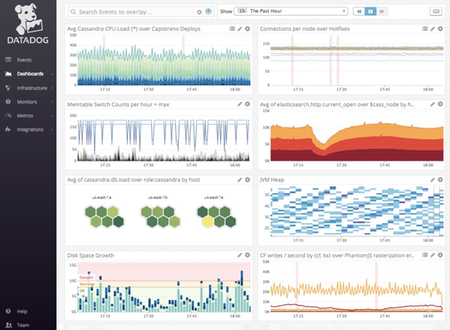
An example of infrastructure monitoring, using Datadog.
 Architecture
 Deployment
 Ingestion
 Modeling
 Operations
 Development


