Using Imply Pivot with Druid to Deduplicate Timeseries Data
Aug 16, 2022
Hellmar Becker
Imagine you are running a solar or wind power plant. You are measuring the power output, among other parameters, on a regular basis, but the measurements are not evenly distributed along the time axis. Sometimes you get several measurements for the same unit of time, sometimes there is only one. How do you measure the average power output without giving undue weight to those time periods that had more measurements?
There are two measurements of power output between 10:00 and 10:15, but only one between 10:15 and 10:30. Ingest those data into Druid with a datasource name of `power_data`. Do not use rollup. Here is the ingestion spec:
Because the average power during the first 15 minutes has been 32 watts, and during the second 15 minutes, 48 watts, you would want to show the average power output as **40 watts**. Keep that in mind.
Using an Average Measure in Pivot
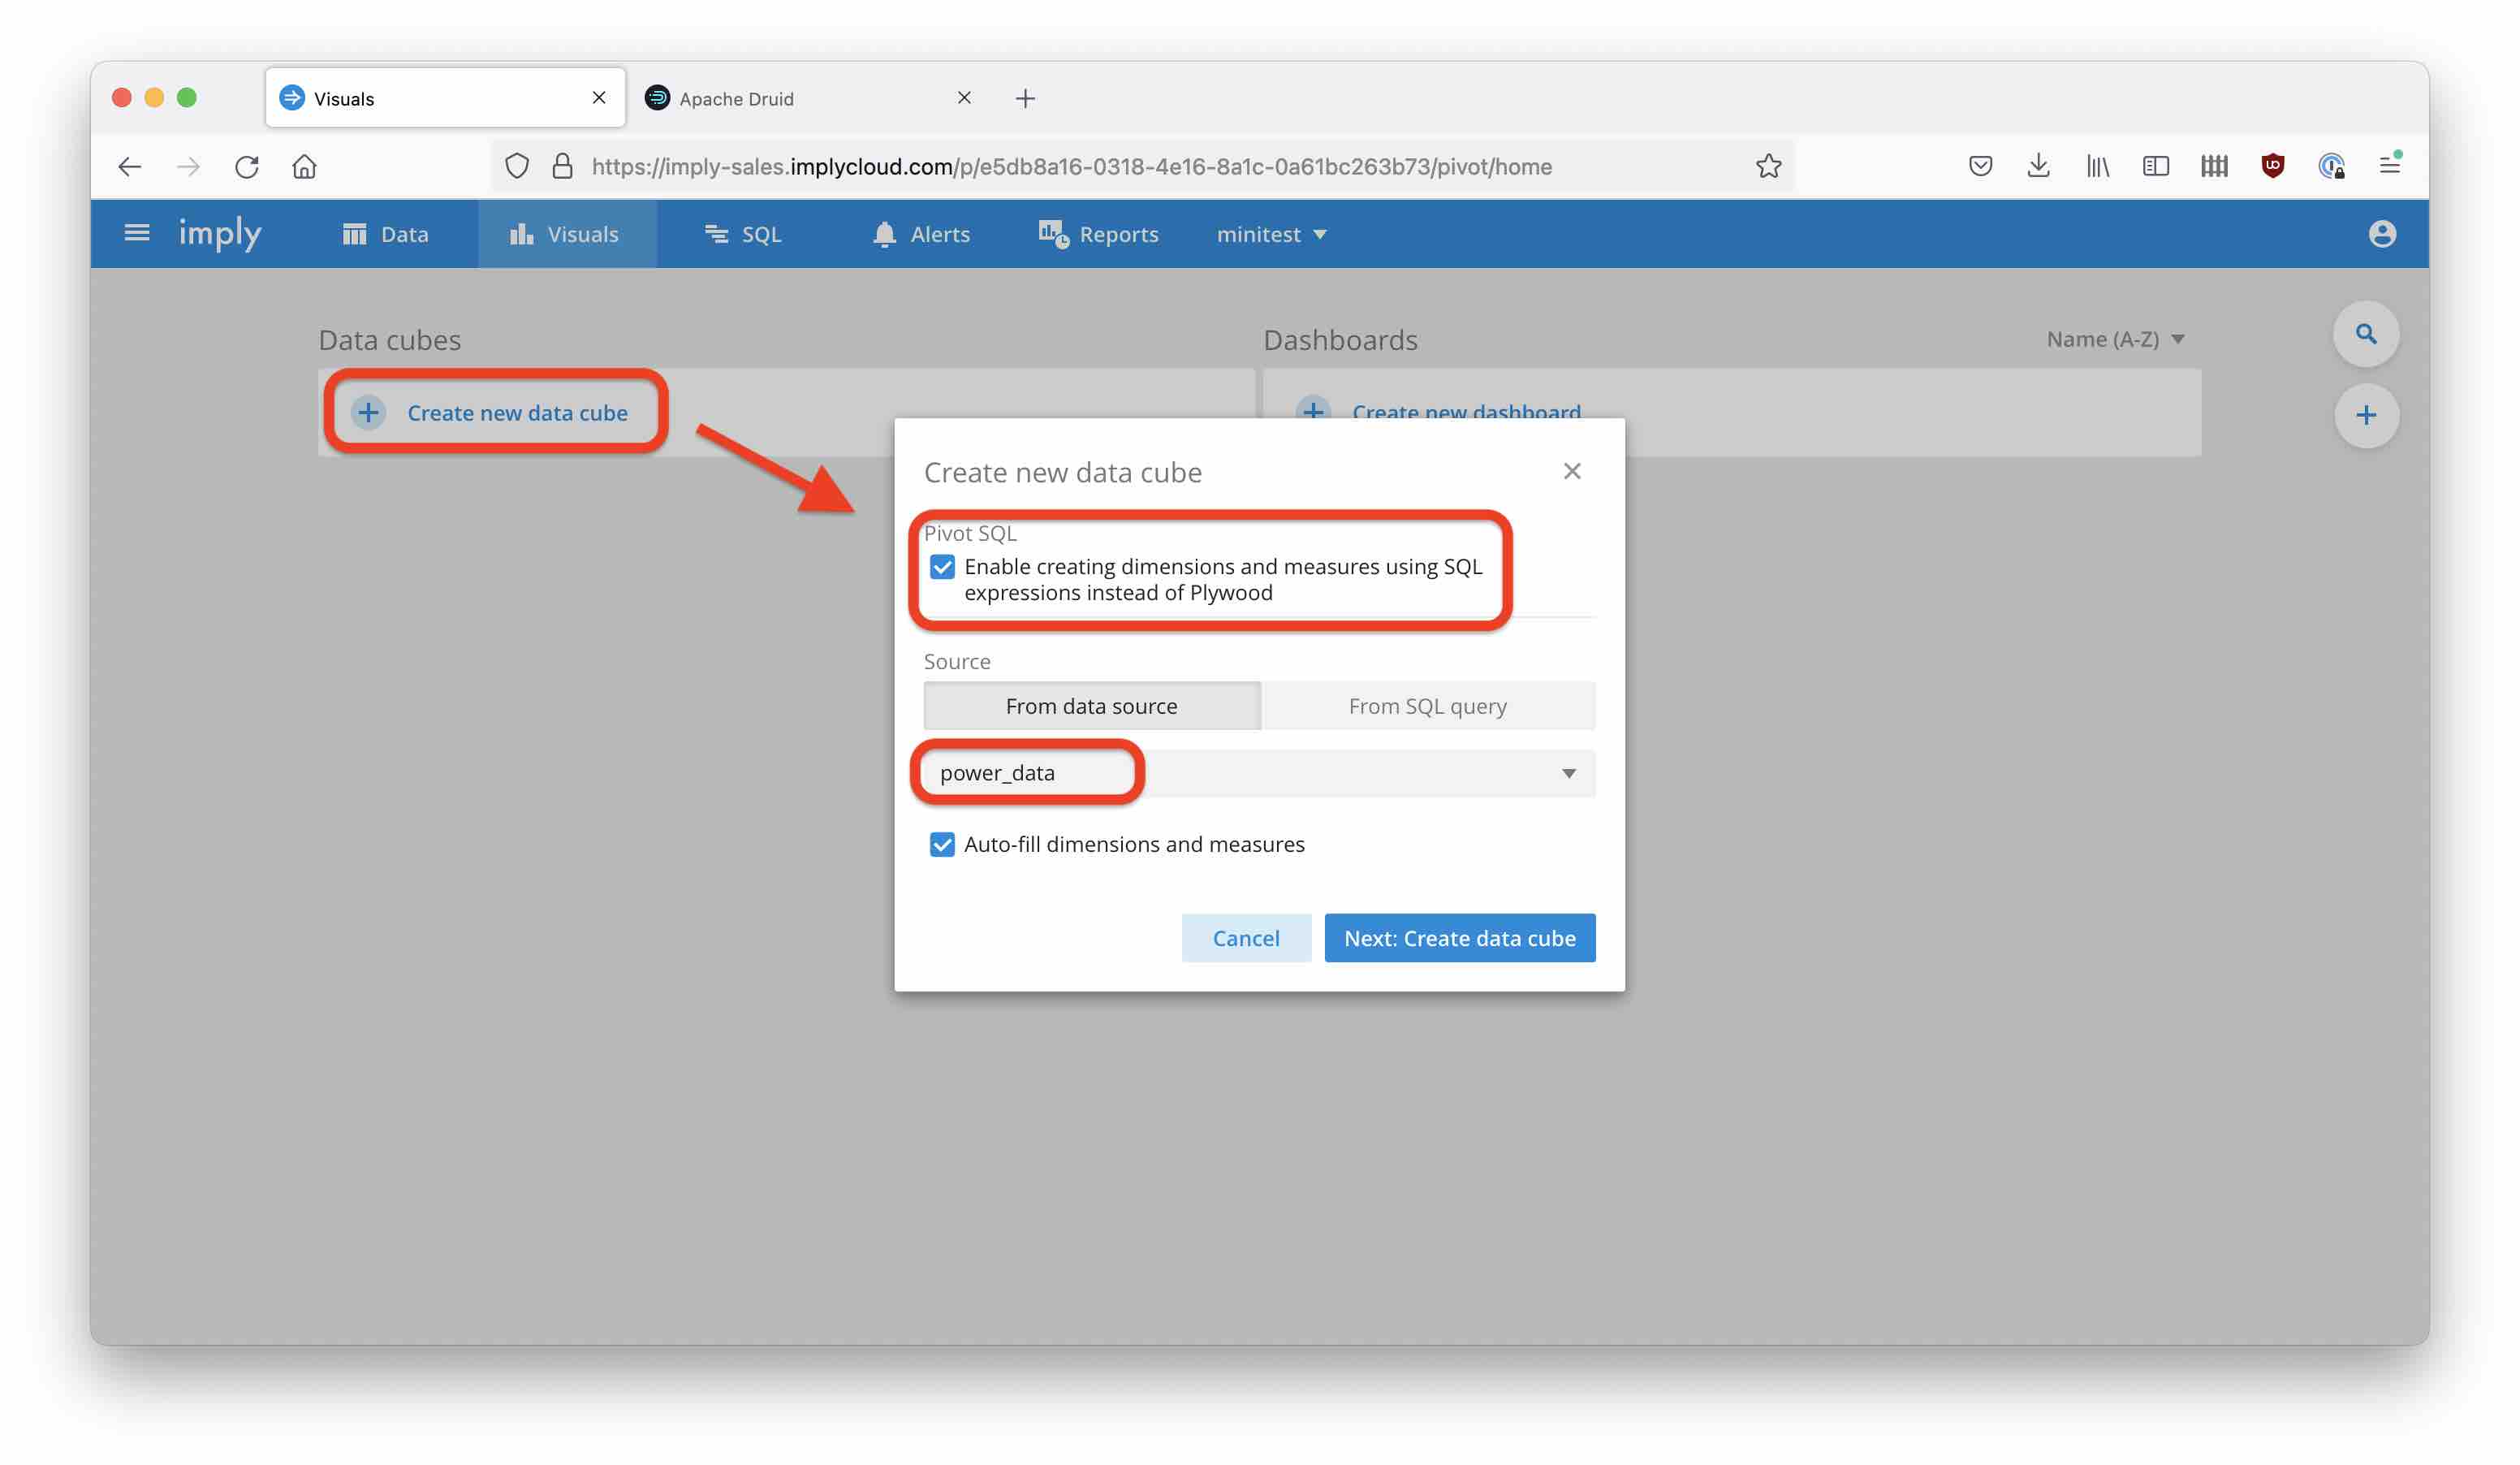
From the Druid datasource, create a cube in Imply Pivot. Make sure it is a SQL cube, and prepopulate the dimensions and measures:
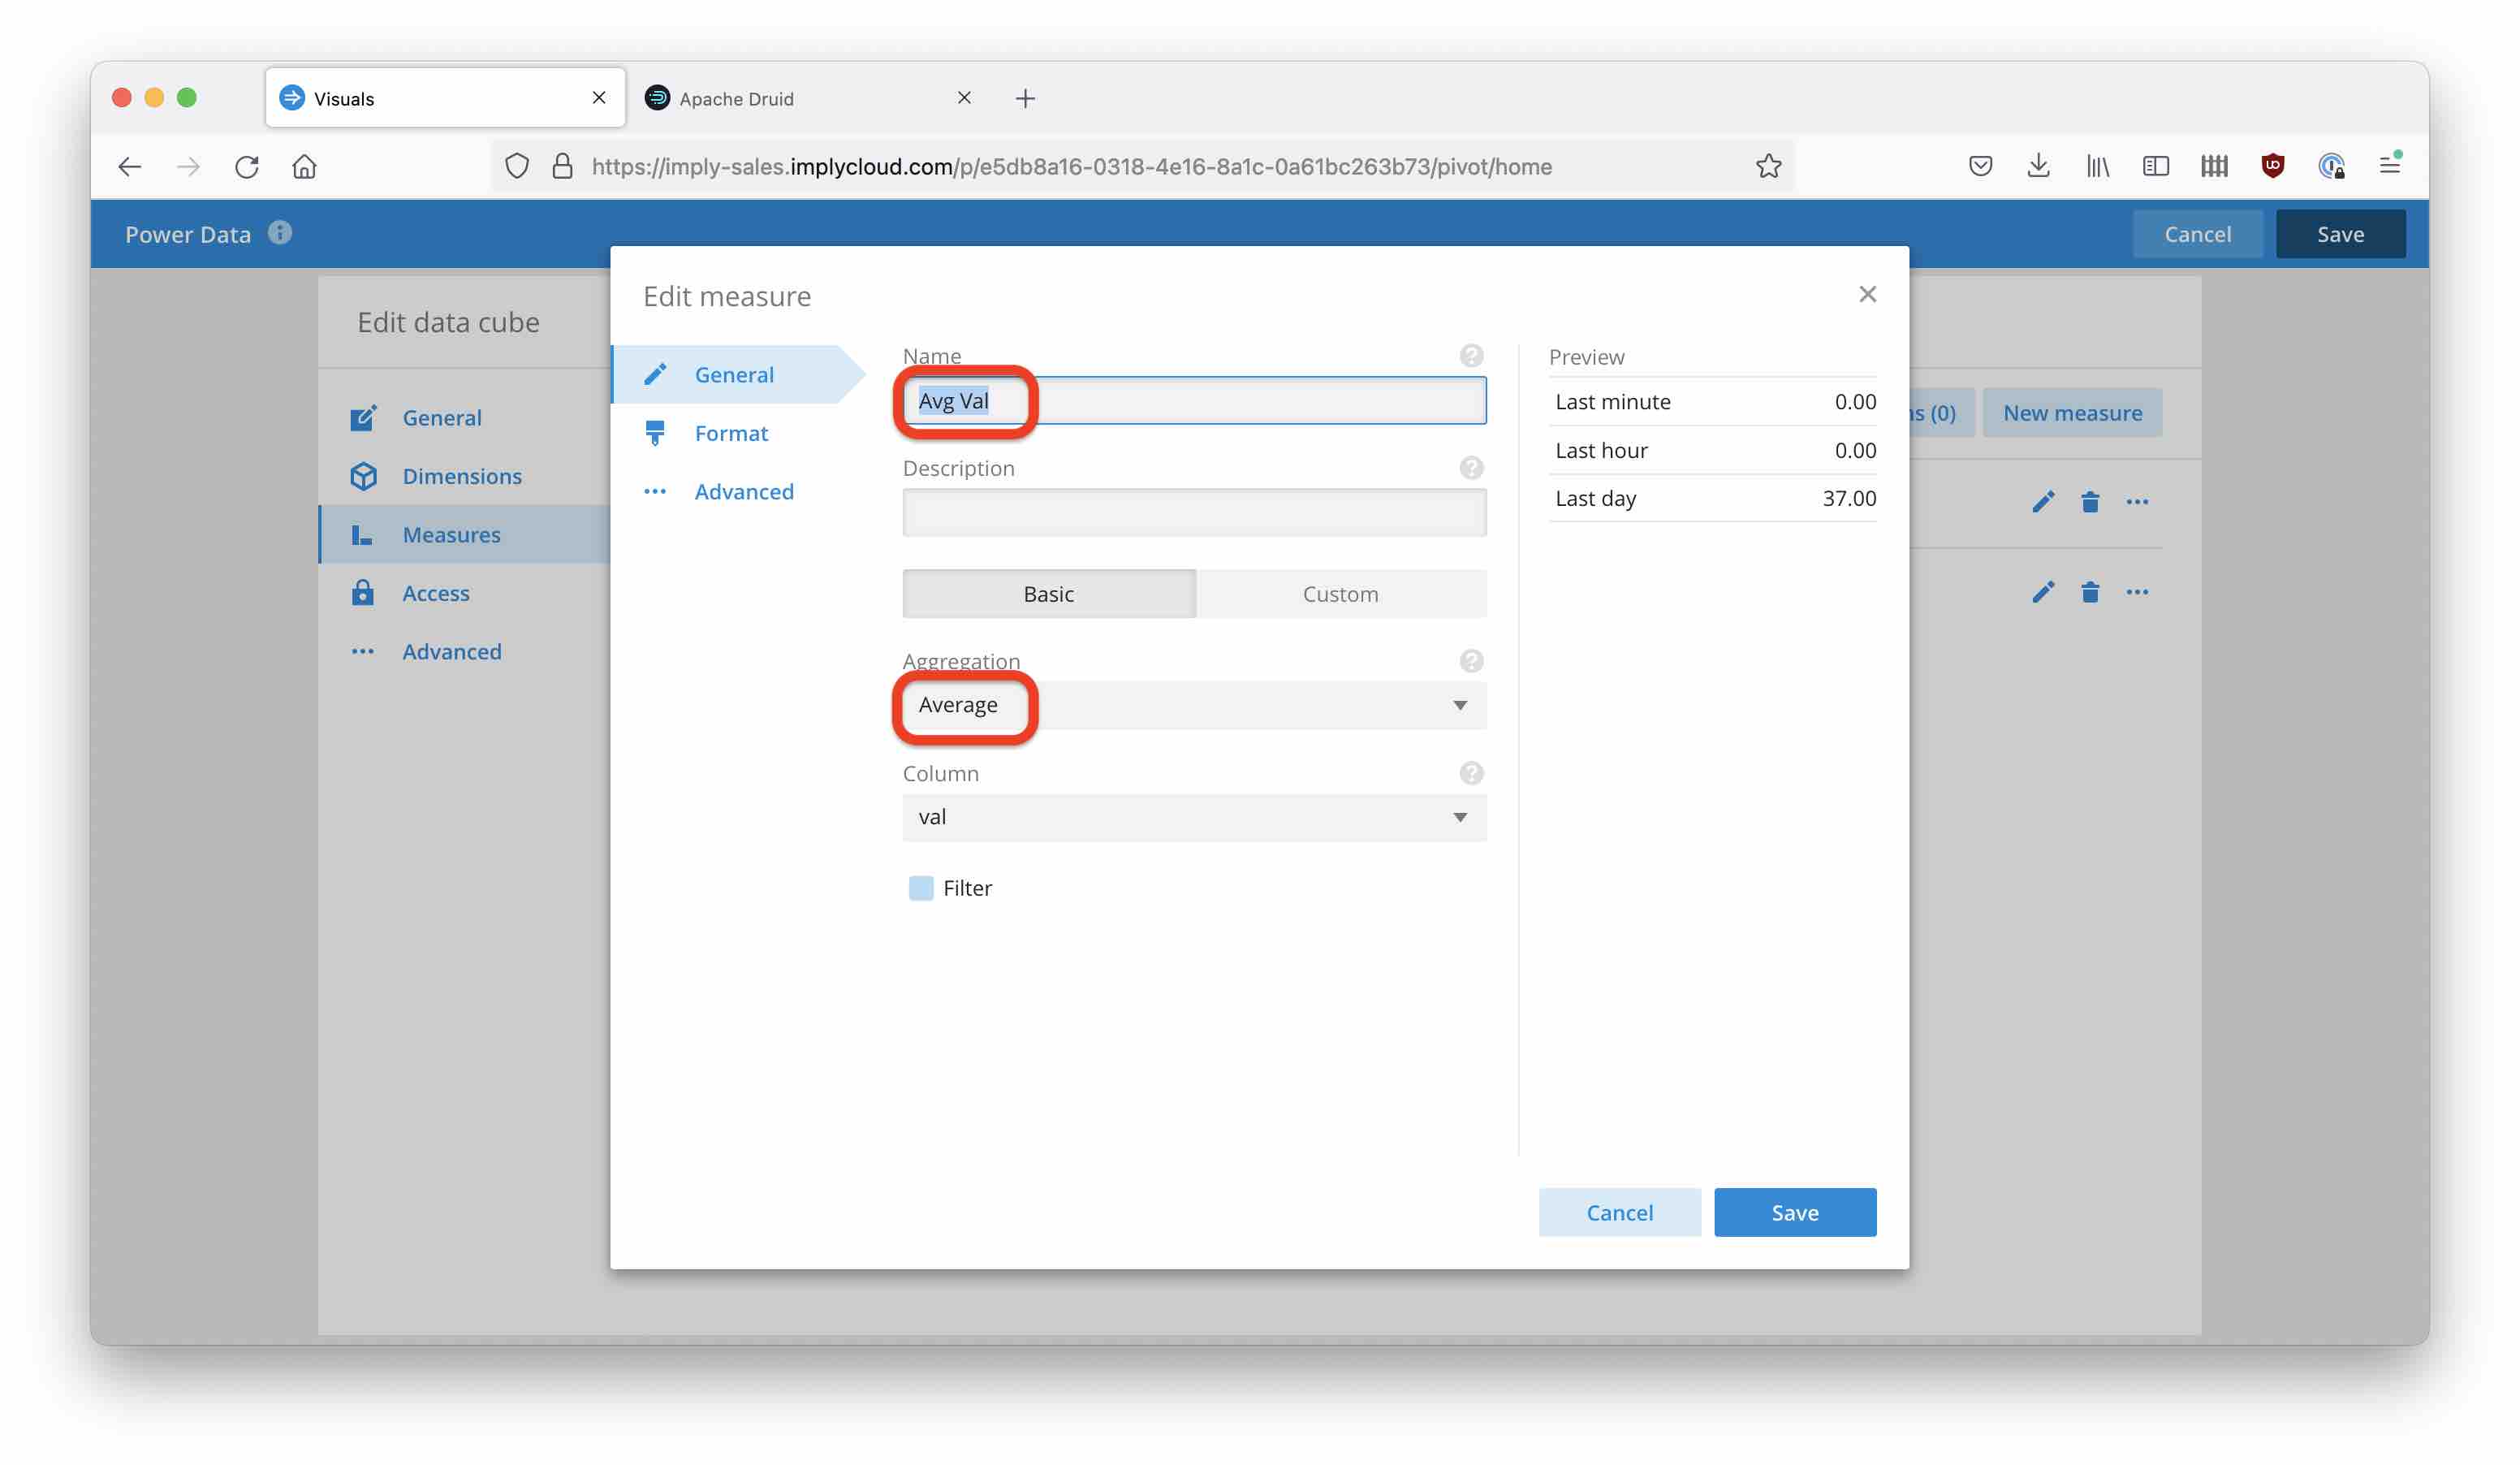
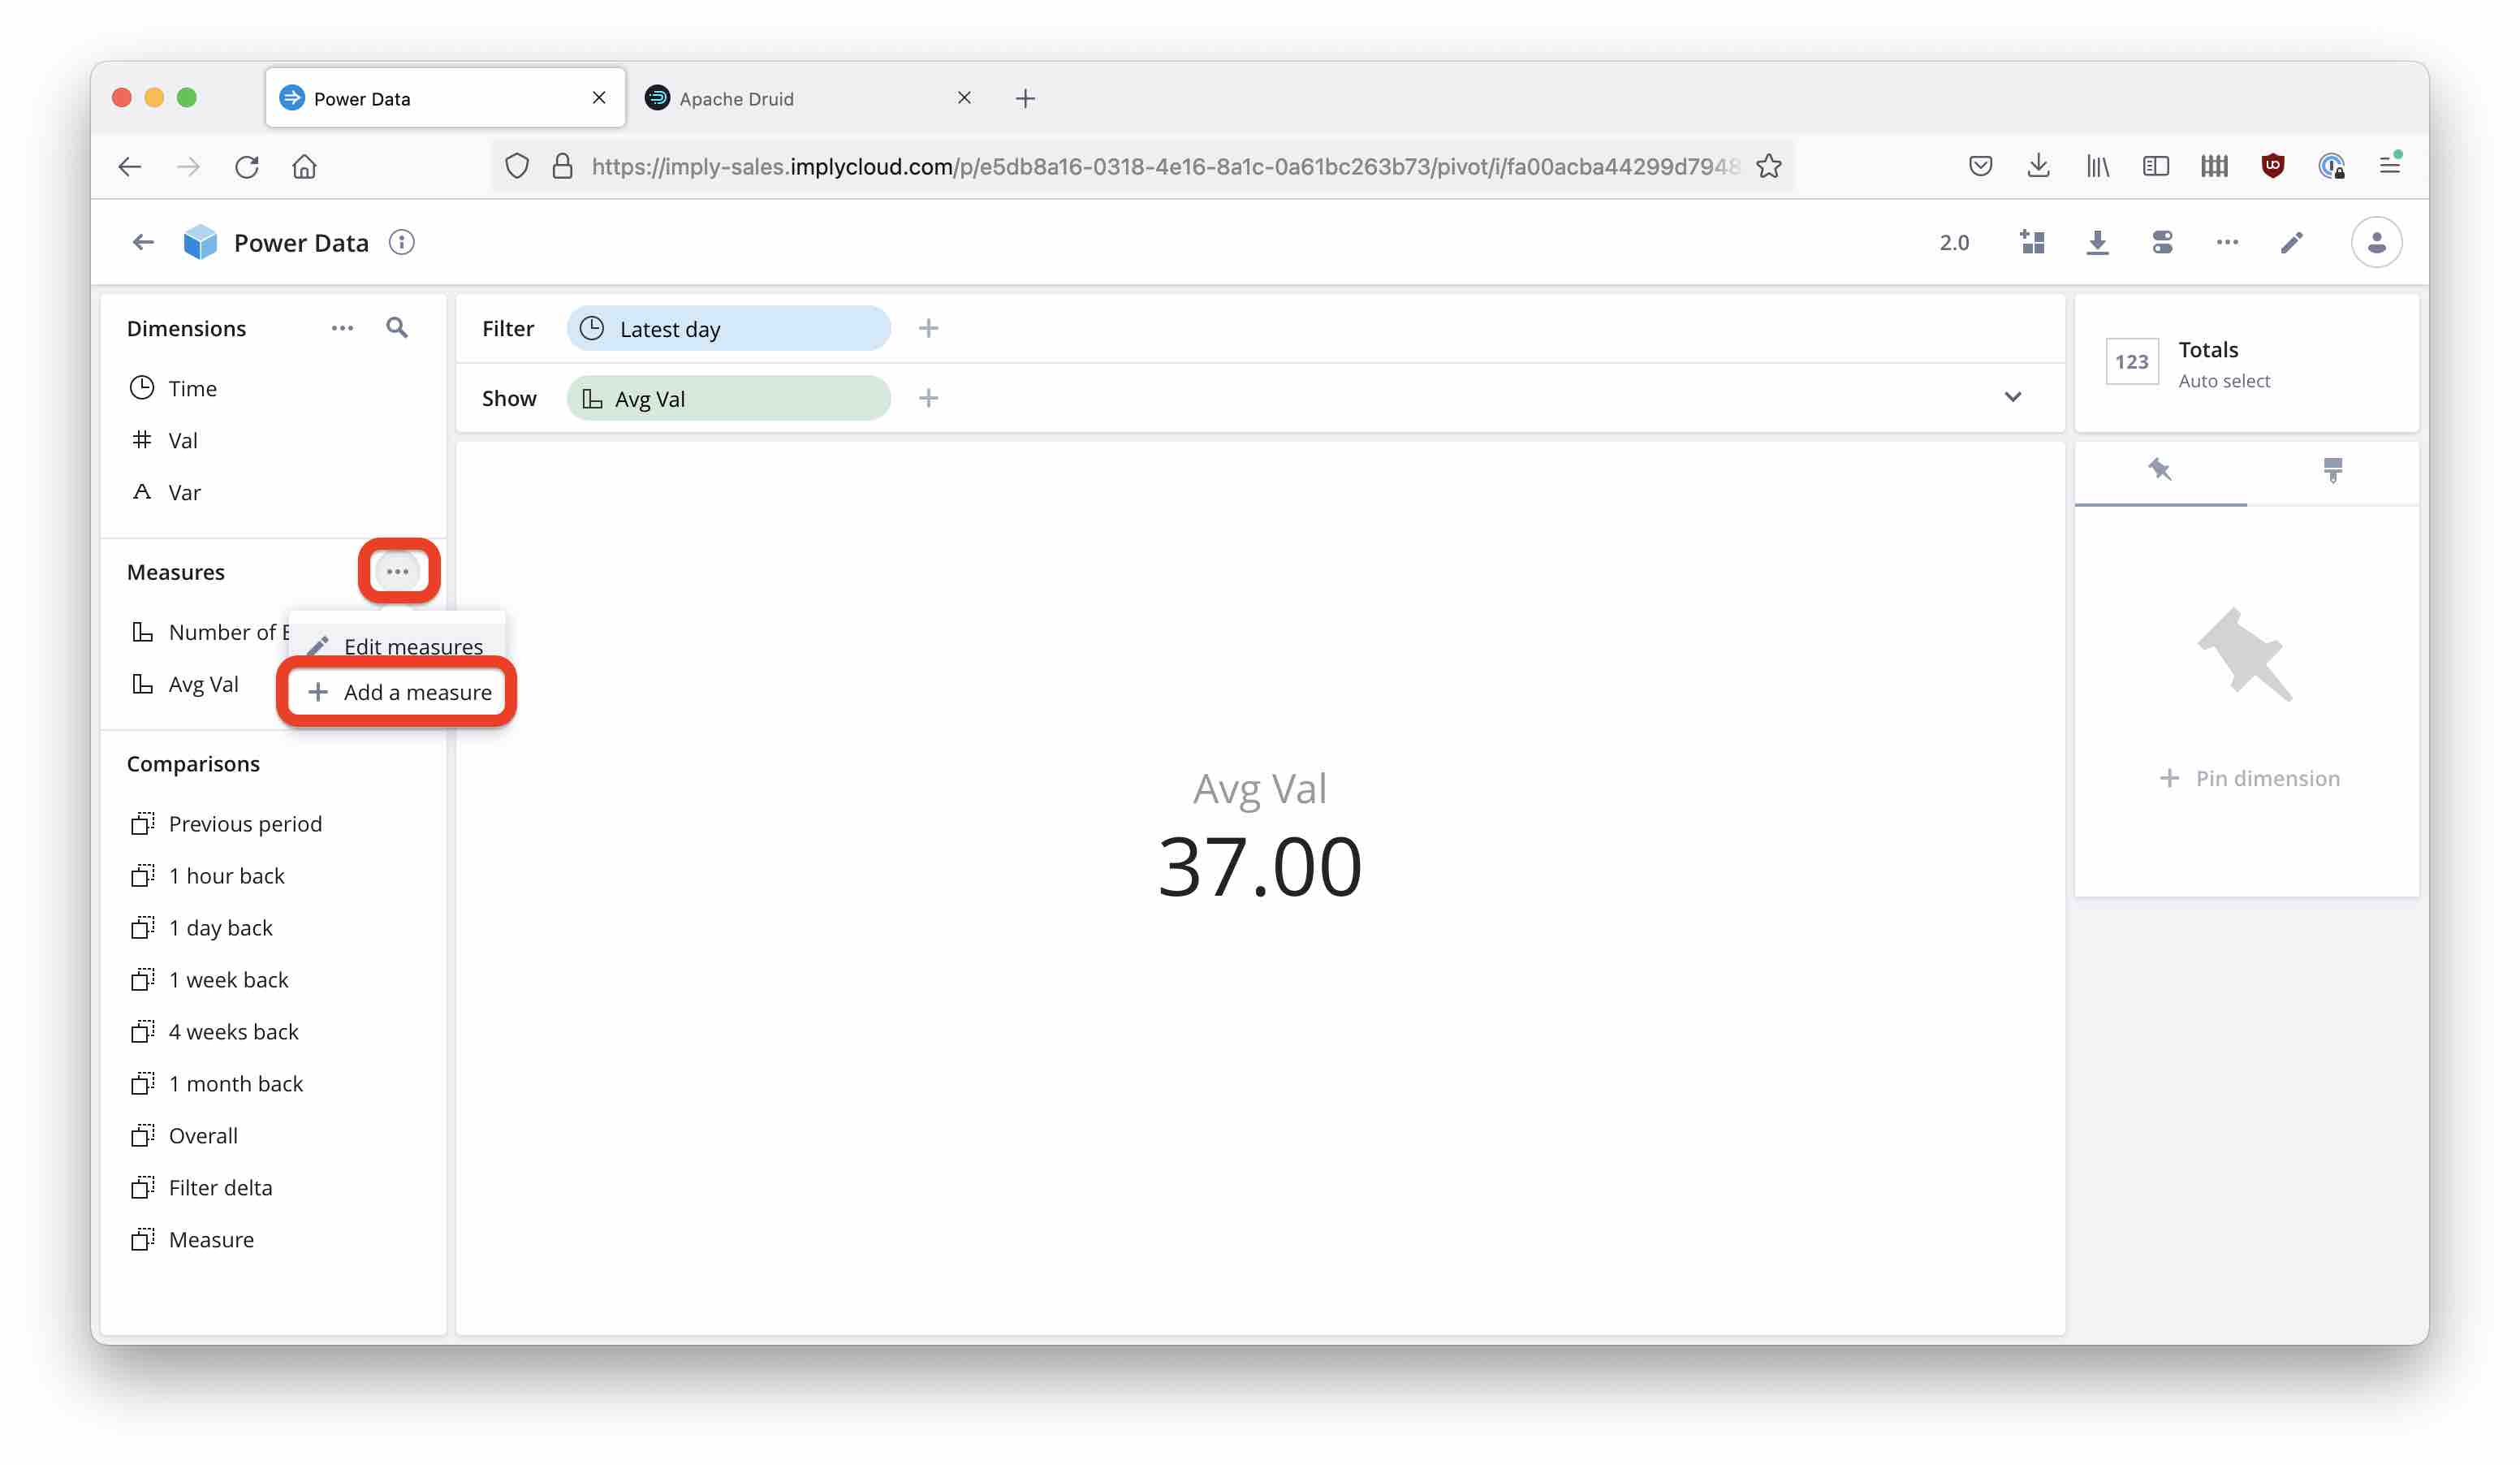
By default, for each numeric field Pivot creates a SUM measure. Change this to Average for the Val measure, and also change the name to Avg Val:
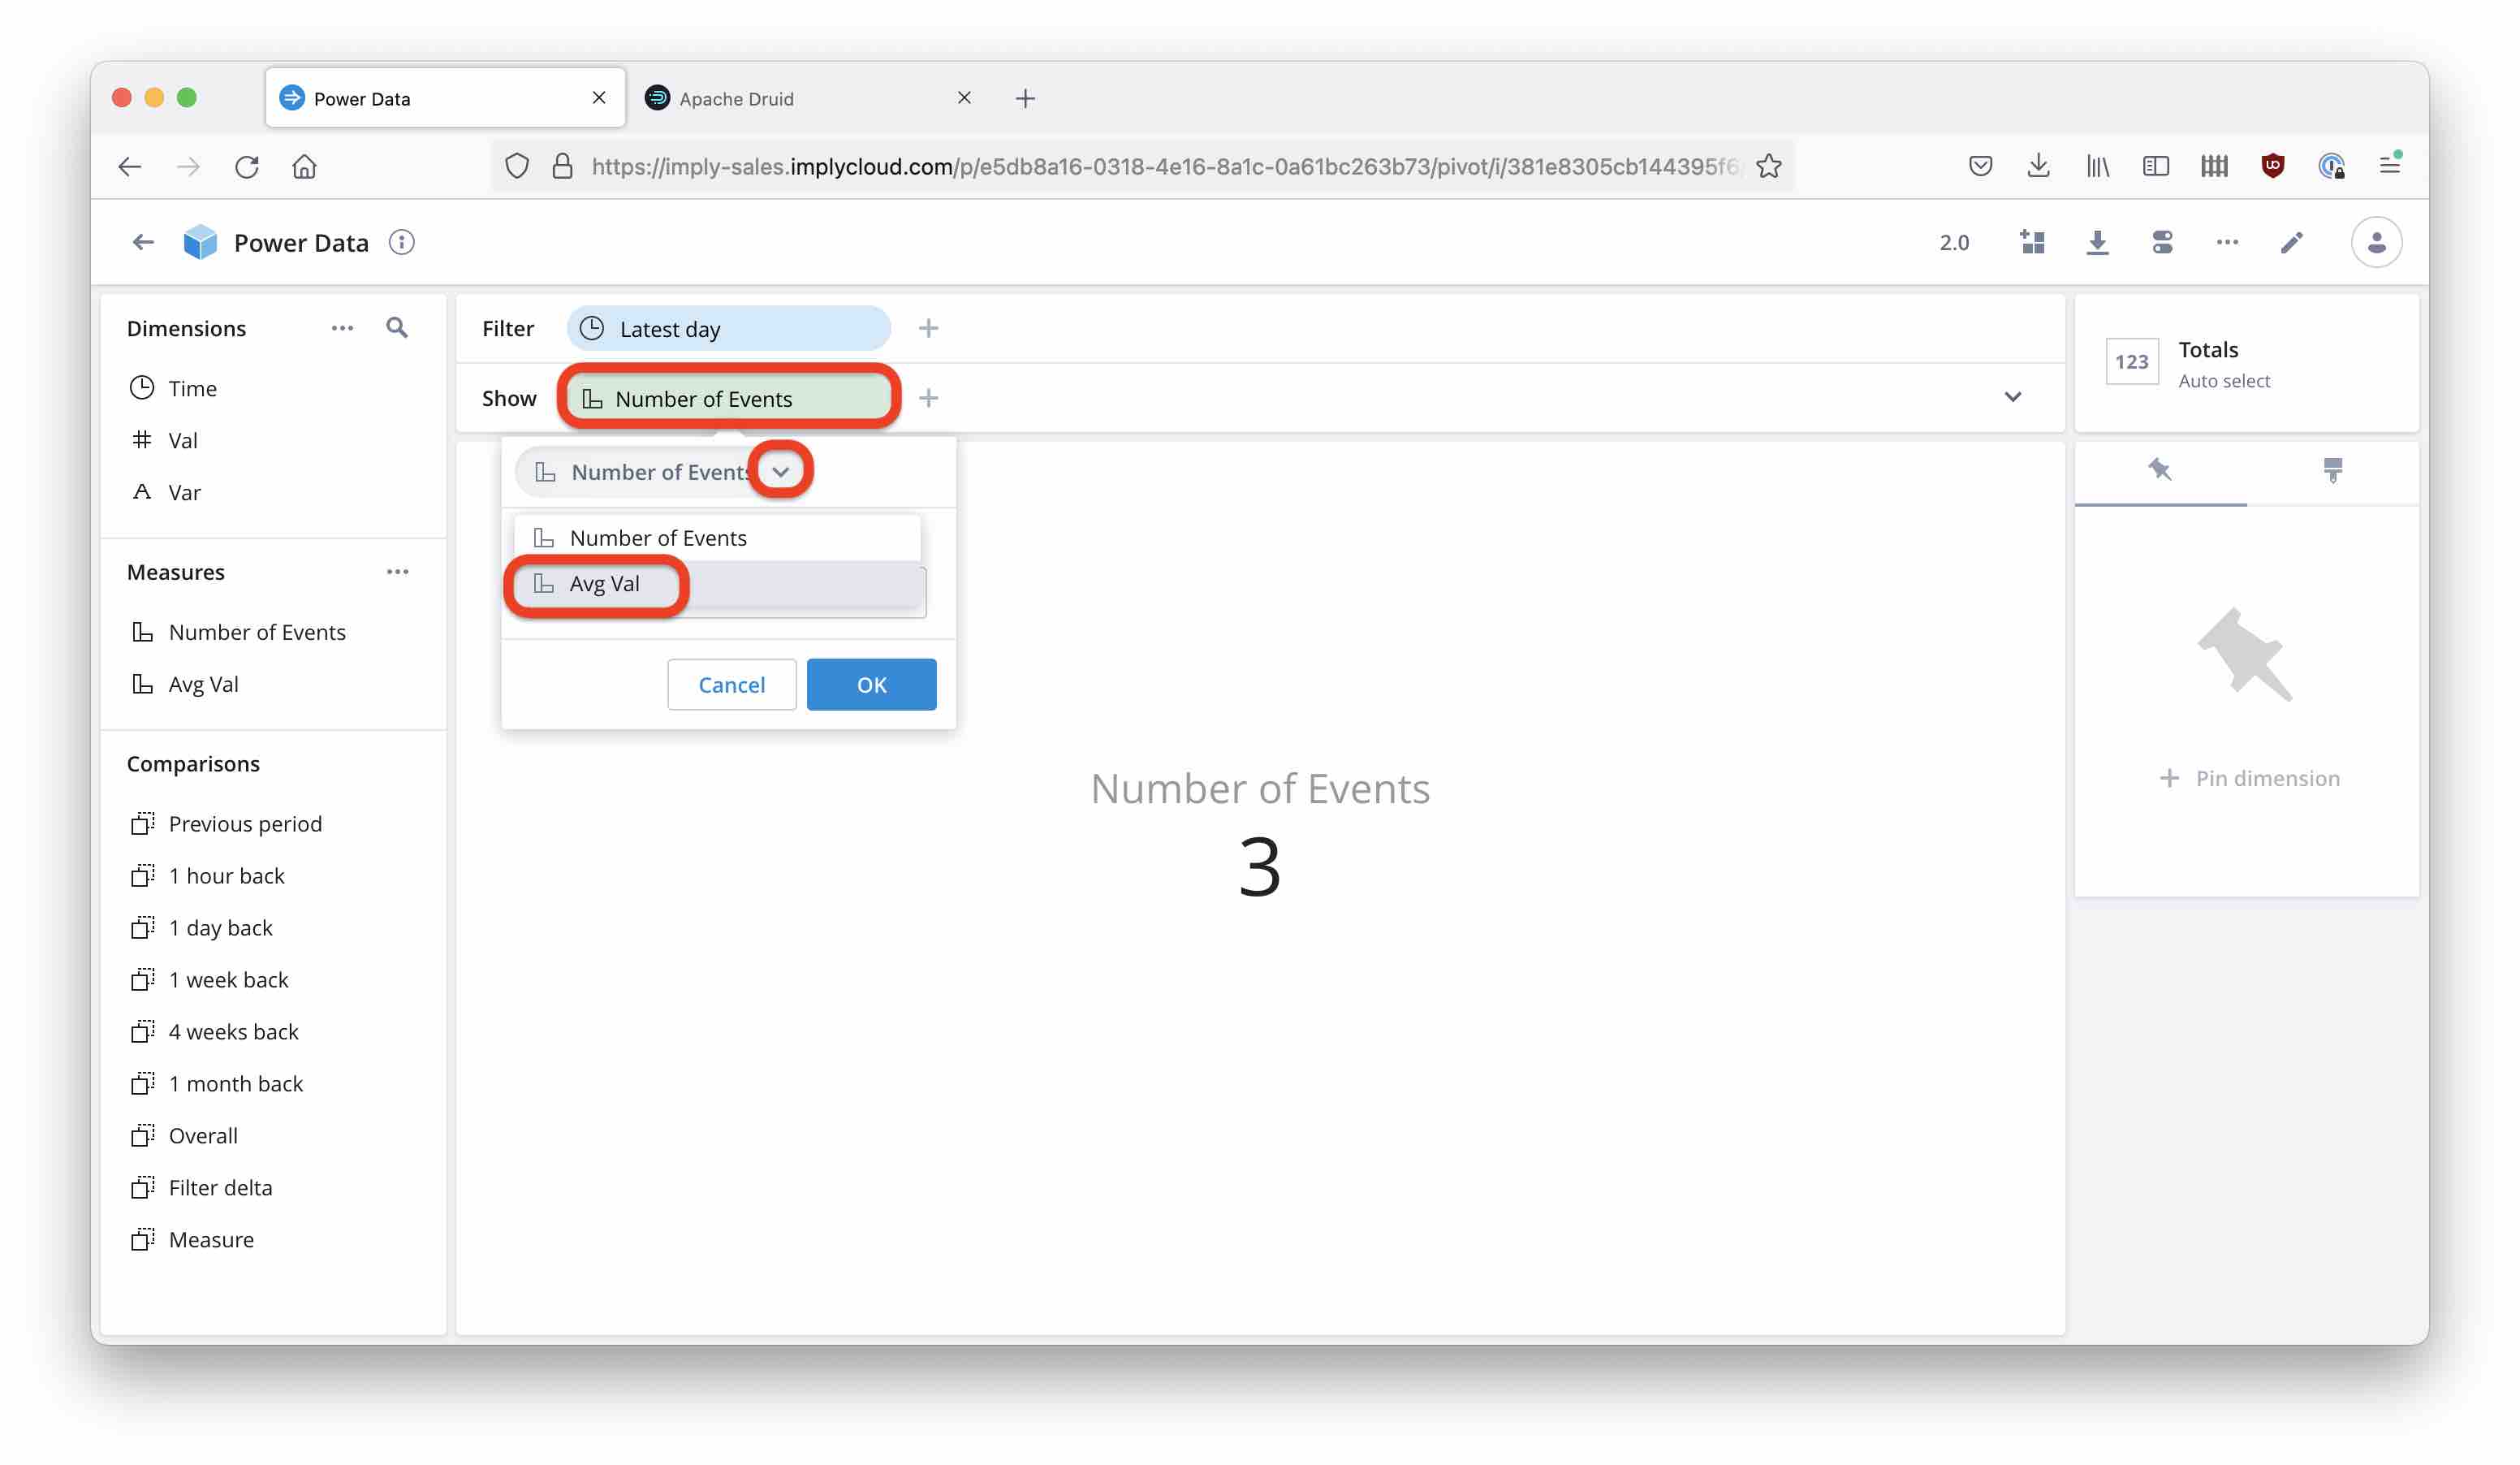
Let’s show this measure in the Cube view. Select the measure:
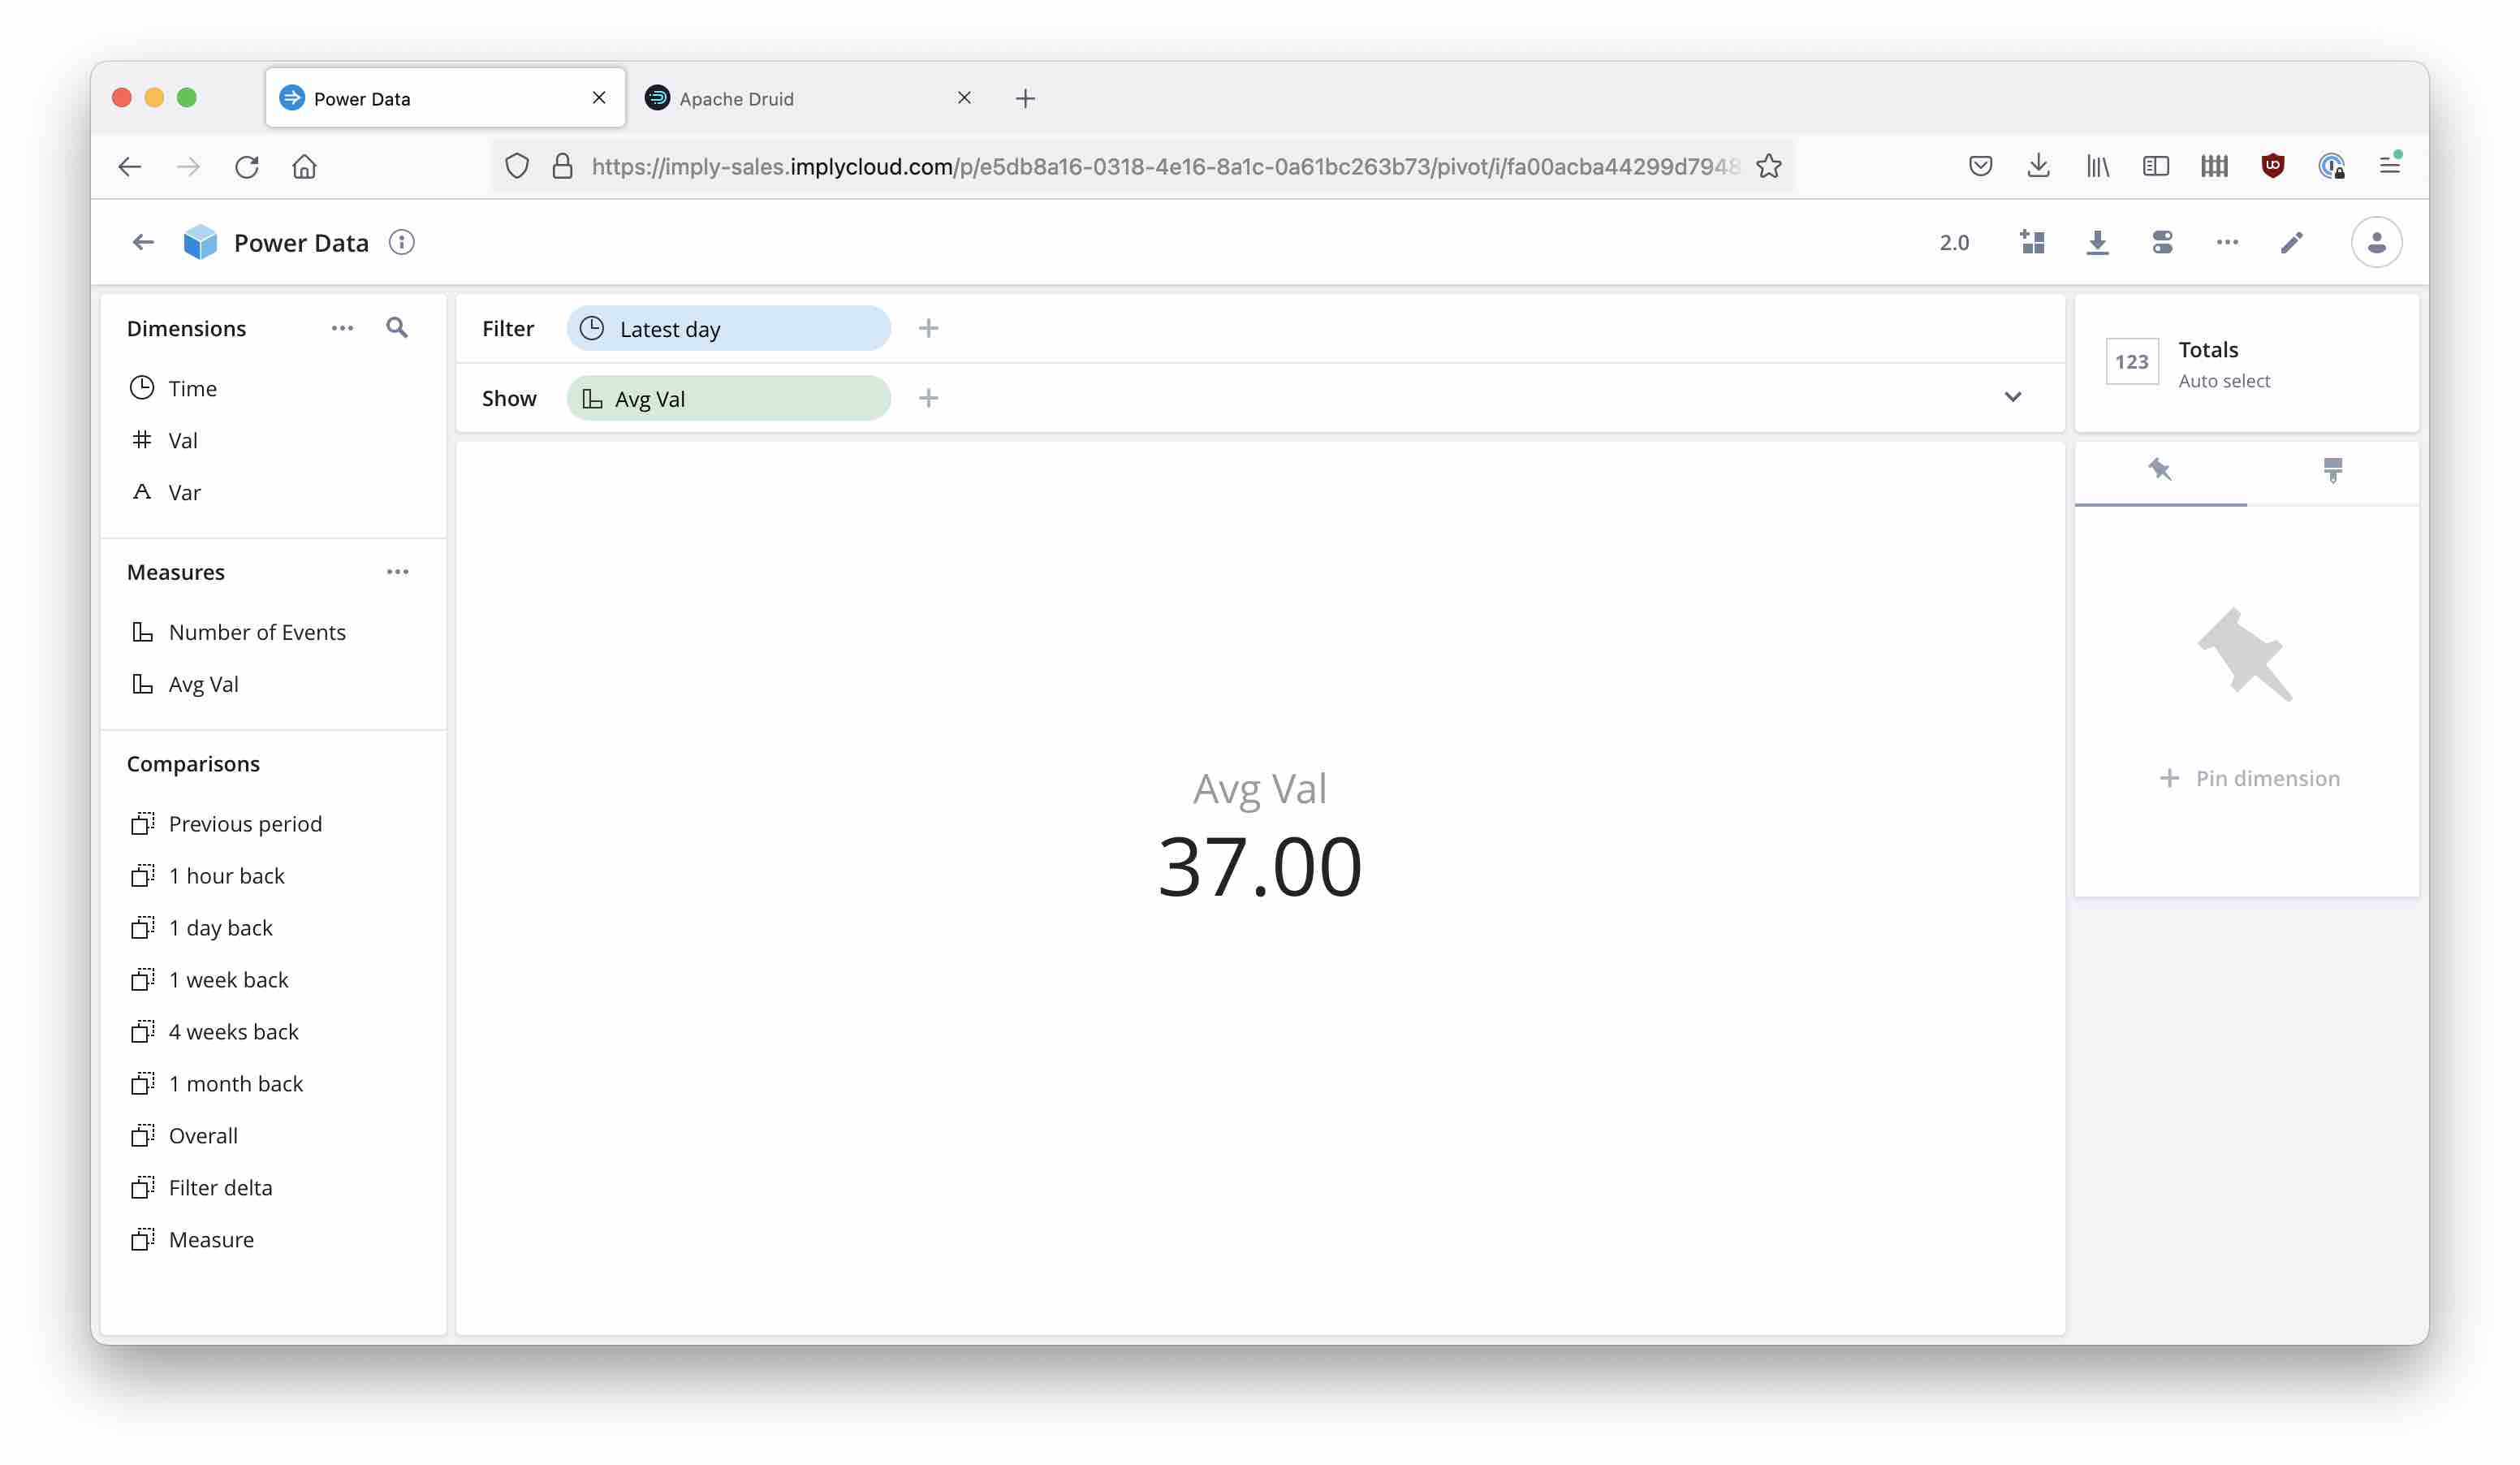
and view the result.
The result is (31 + 33 + 48) / 3 = 37, which is the correct average but not the answer to the question in this case. What you would like to do is:
Take the average of all measurements for each 15 minute interval
Then take the average of the results from step 1.
This is actually possible with Imply Pivot.
Nested Aggregation Measures
Pivot offers multi step aggregations in what is called nested aggregations. Here, you can define an expression to split the data first into buckets in which to aggregate (the inner aggregation), then an outer aggregation runs over the results of the inner aggregation.
In this case, the split expression should yield 15 minute buckets, and both aggregations are averages.
Add a new measure to your cube:
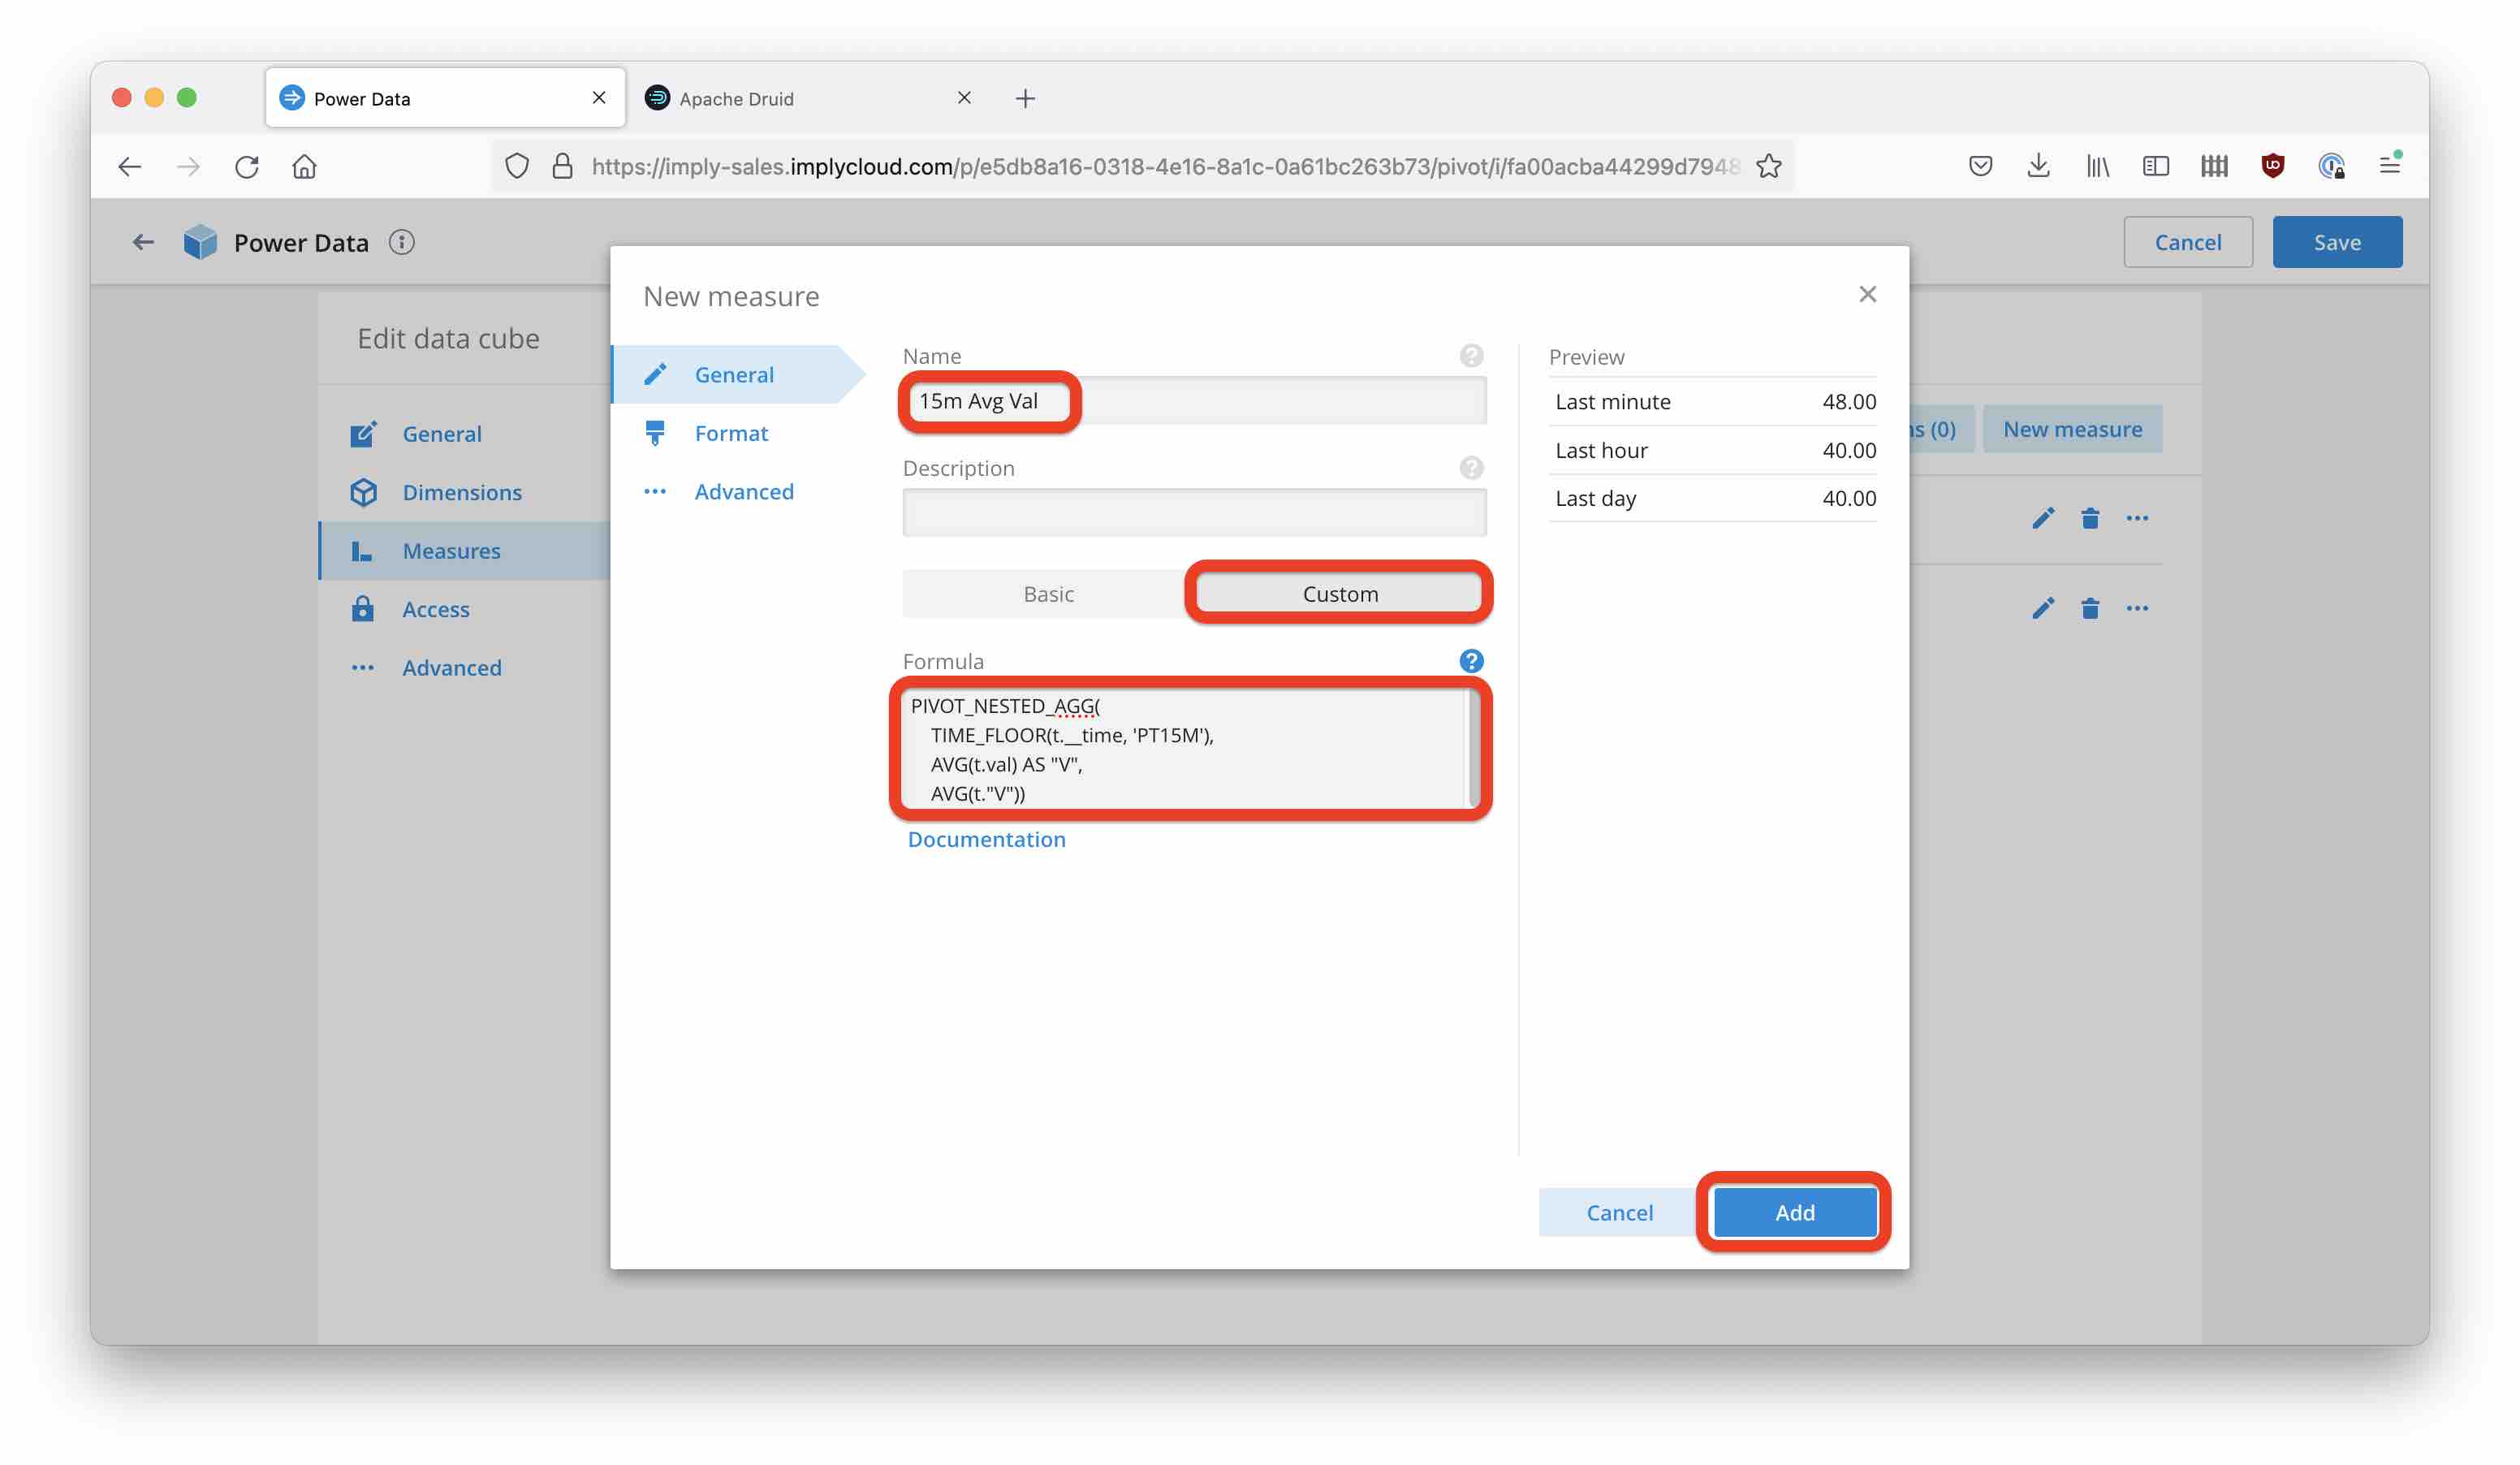
And define the new measure with a custom SQL expression:
Here is the SQL expression for copying:
PIVOT_NESTED_AGG(
    TIME_FLOOR(t.__time, 'PT15M'),
    AVG(t.val) AS "V",
    AVG(t."V"))
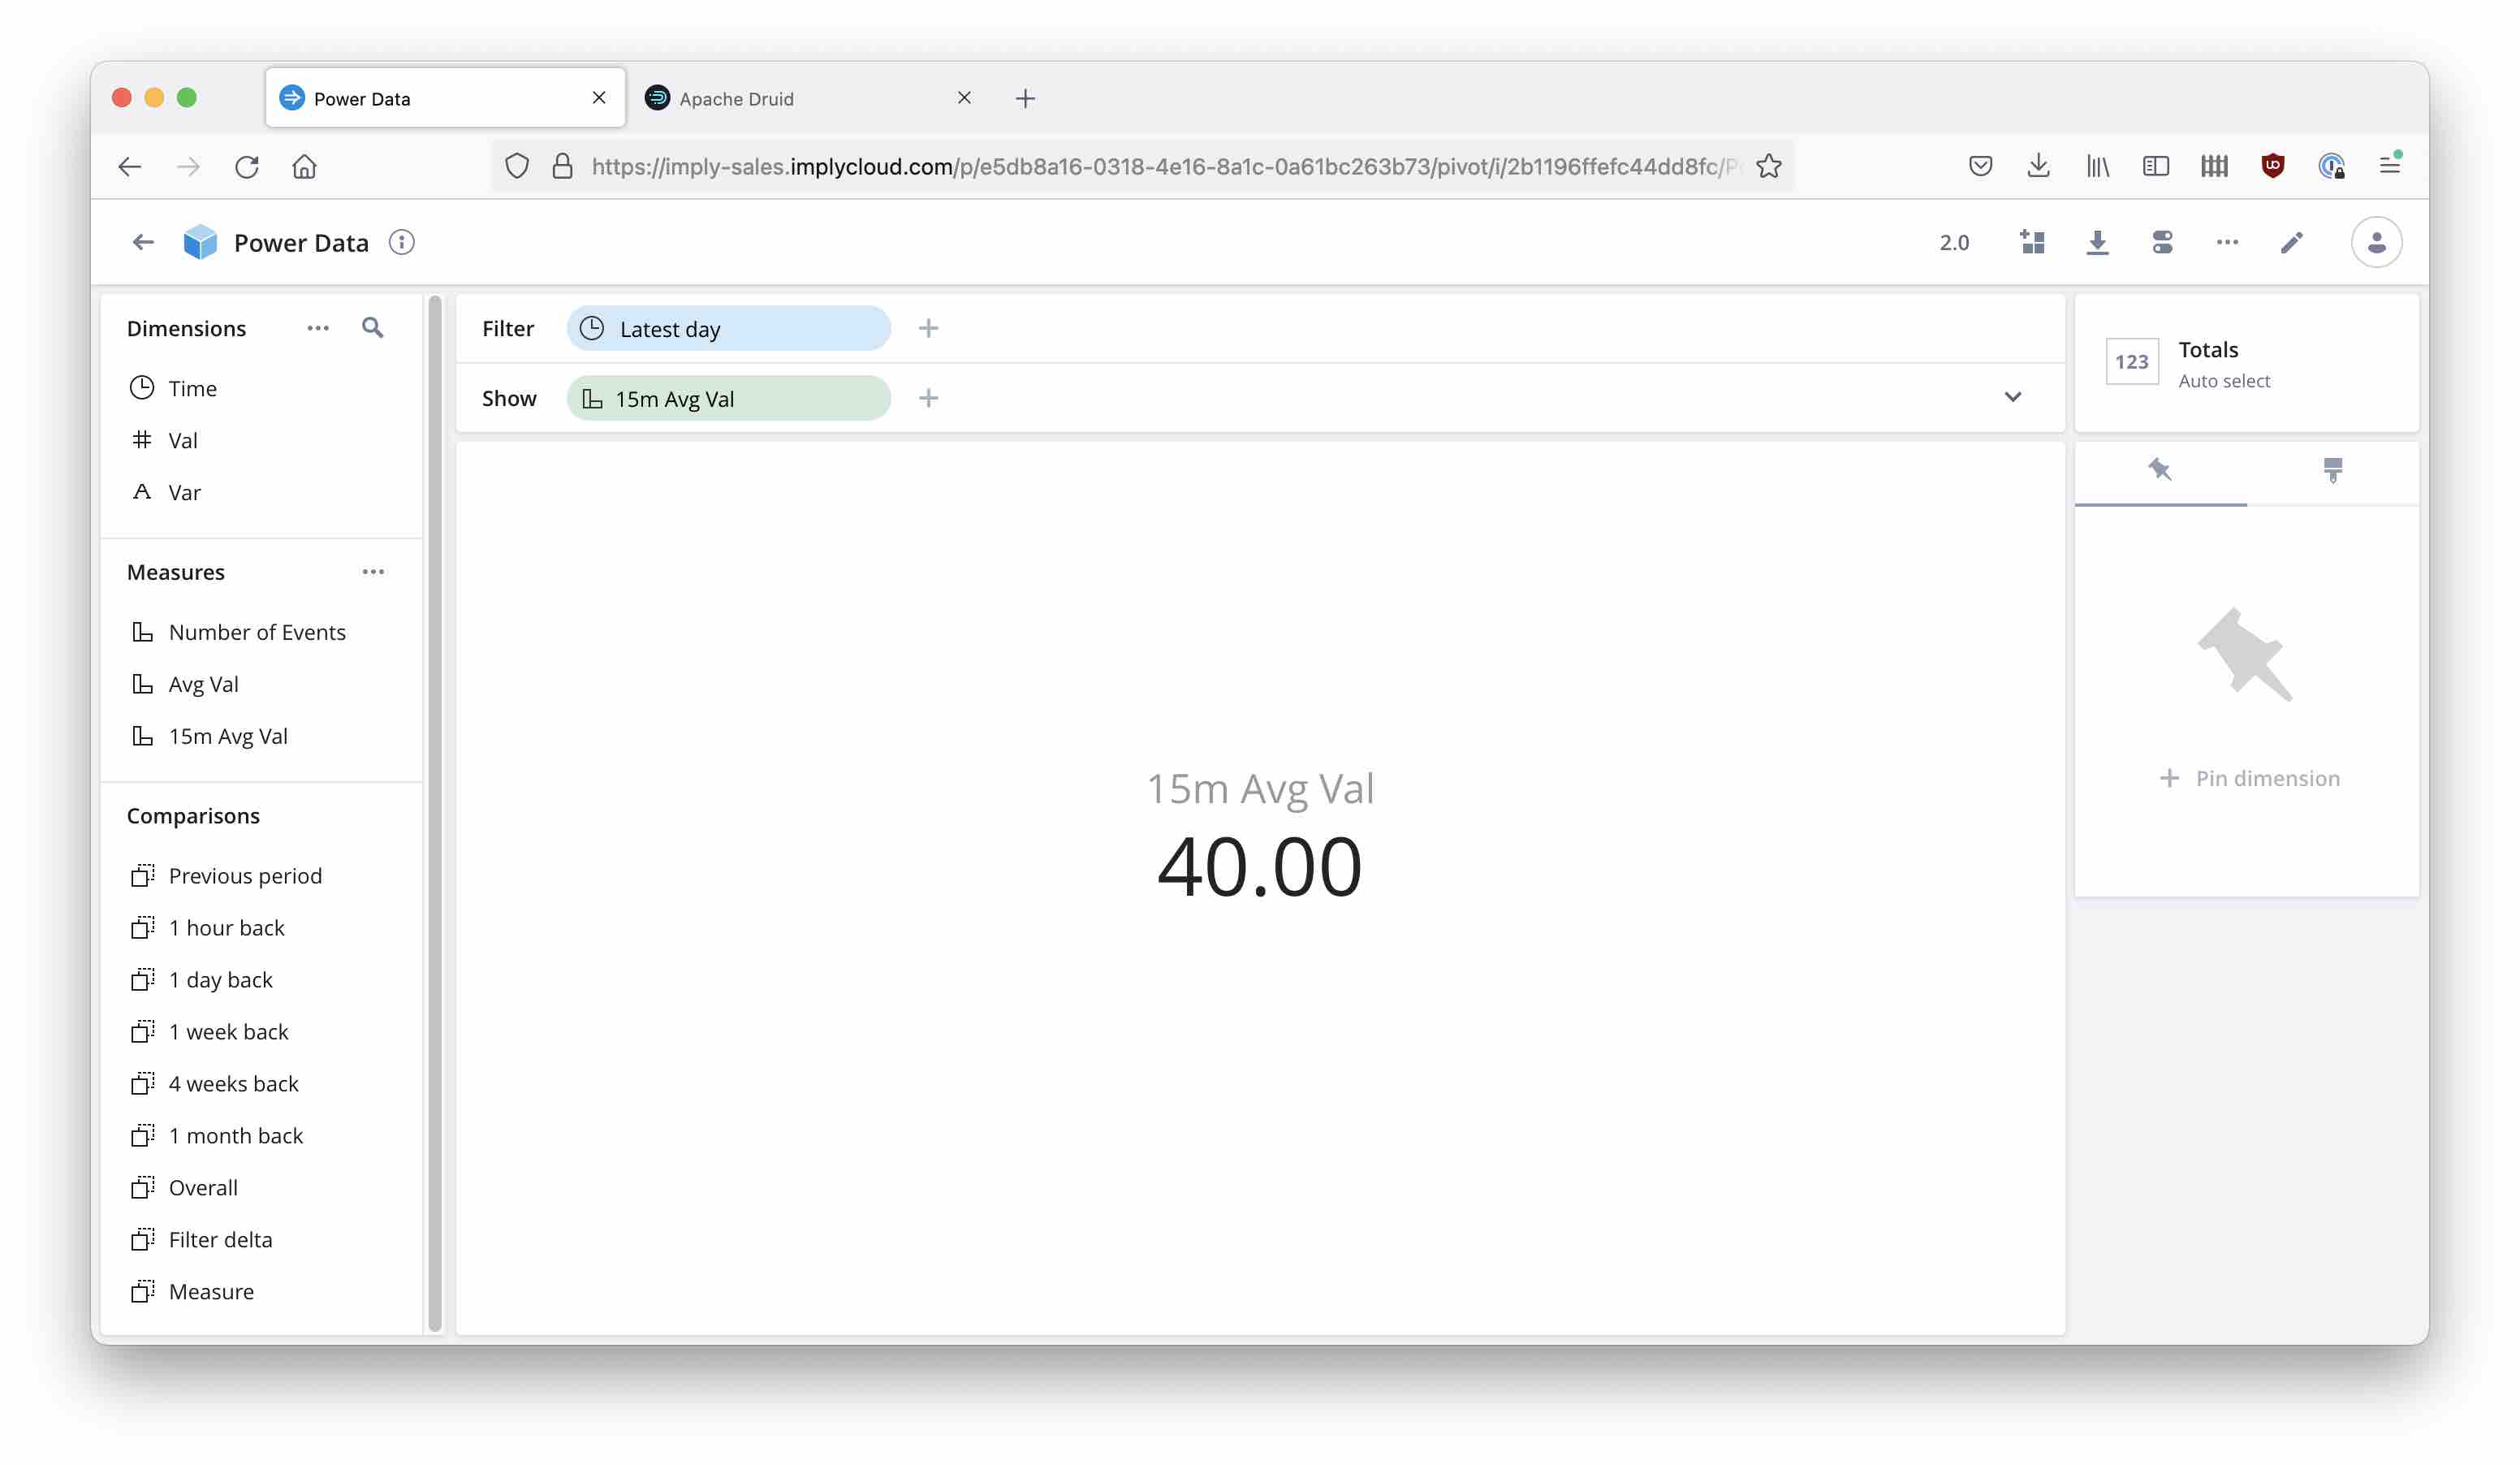
Display the new 15m Avg Val measure instead of the naïve average. This time the result matches the requirement:
If you enable query monitoring, you can see that Pivot generates a nested query with two levels of GROUP BY:
SELECT
AVG(t."V") AS __VALUE__
FROM (SELECT
AVG(t.val) AS "V"
FROM "power_data" AS t
WHERE (TIMESTAMP '2022-07-30 10:19:00'<=(t."__time") AND (t."__time")<TIMESTAMP '2022-07-31 10:19:00')
GROUP BY TIME_FLOOR(t.__time, 'PT15M')) AS t
GROUP BY ()
This is valuable for timeseries data where measures are not evenly distributed in time.
Use the TIME_FLOOR function to define intermediate buckets.
Other blogs you might find interesting
No records found...
May 07, 2025
Real-Time Observability Without Operational Overhead: What’s Next?
Observability is meant to provide clarity, speed, and confidence in modern systems. Yet for many organizations, it has become a source of complexity, cost, and operational drag. Managing pipelines, tuning...
It’s Time to Rethink Observability: The Event-Driven Future
Observability has evolved. Forward-looking teams are already moving beyond static dashboards and fragmented telemetry—treating all observability data as events and unlocking real-time insights across their...
5 Reasons to Use Imply Polaris over Apache Druid for Real-Time Analytics
Introduction Real-time analytics is a game-changer for businesses that need to make fast, data-driven decisions. Whether you’re analyzing user activity, monitoring applications and infrastructure, detecting...