At Imply, our Developer Center plays a key role: walking readers through common scenarios, explaining key features, highlighting helpful shortcuts and solutions, and more. Each season, we will highlight the best of our Developer Center articles, tutorials, recipes, and lessons across all categories. All of this content is relevant and engaging—and hopefully, will help you make the most of your Apache Druid or Imply experience.
Metrics Observability Made Easy
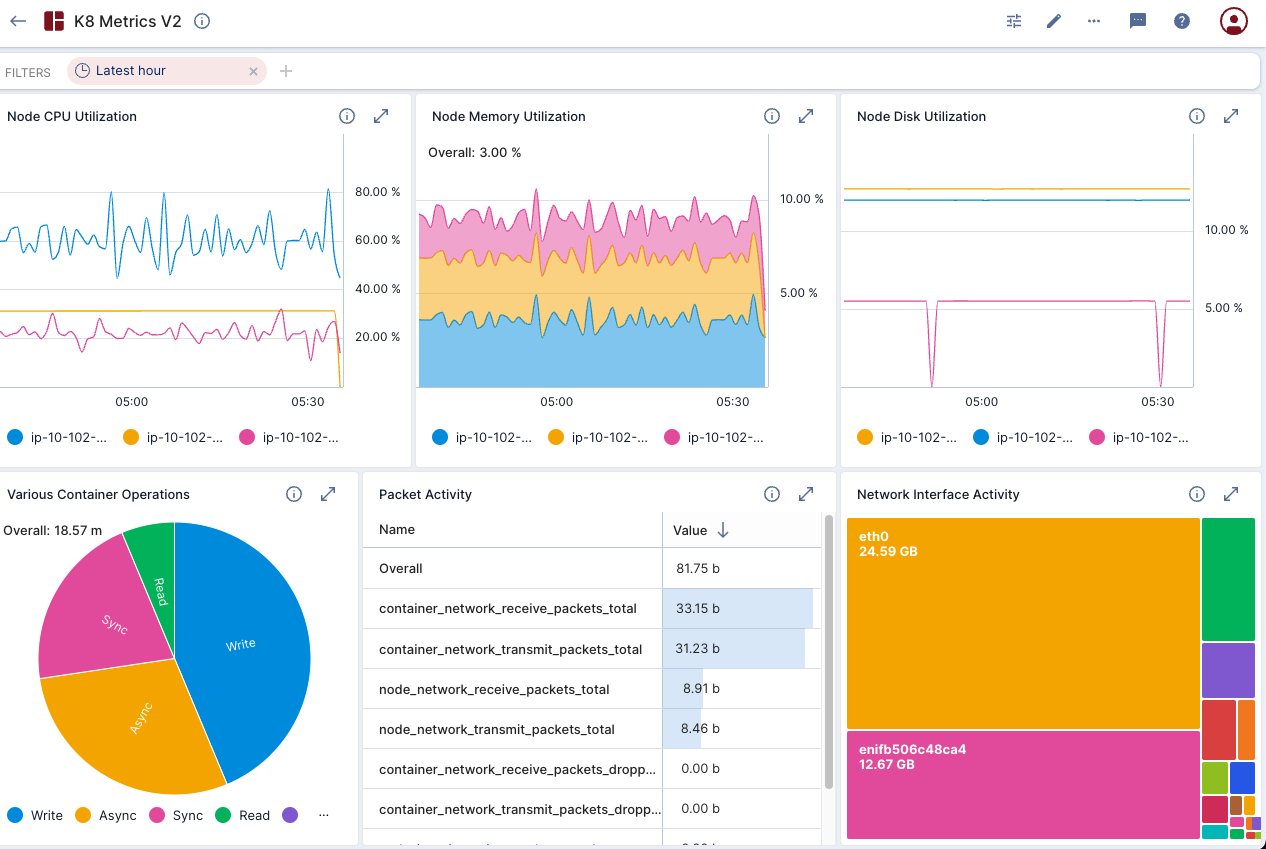
In case you missed it, the Imply team recently published a new, in-depth walkthrough of attaining metrics observability. Written by Senior Sales Engineer Anil Gupta, Engineering Manager Jove Kuang, and Solutions Architects Ravin Trivedi and Mohan Vedicherla, this 16,000 word guide is a comprehensive but easy read, packed with diagrams, code snippets, and UI screencaps.
Figure 1. A sample observability dashboard created by Anil and his team.
In this article, Anil and his team explain some common observability challenges, introduce some common architectures, and provide a step-by-step explanation of building an end-to-end monitoring solution utilizing Prometheus metrics, streaming data (via Confluent Cloud), and dashboards with Imply Polaris’ built-in visualization layer. Along the way, Anil and colleagues also explain the finer points of some common operations, such as filtering or dragging and dropping via data cubes.
Read their tutorial here.
How to Connect Pivot to Multiple Druid Clusters
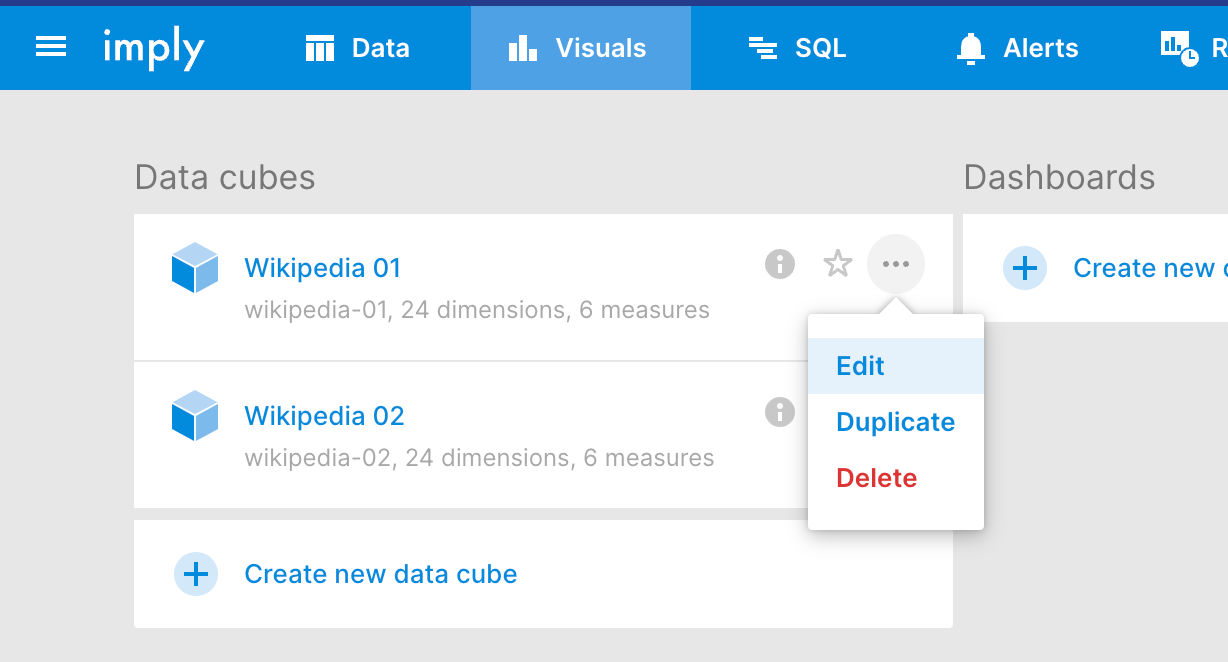
One of our most popular products, Pivot is an intuitive GUI for creating, sharing (via browser link), and embedding interactive data graphics and dashboards. In a world where real-time data is key to everything from observability to IoT, teams can use Pivot’s visualizations to explore and understand data from multiple perspectives.
Figure 2. Kyle takes readers through building data cubes.
In this article, Sales Engineer Kyle Hoondert guides readers through connecting Pivot to multiple Imply clusters, an important operation that can help improve data visibility and provide additional context to teams. Kyle also guides readers through configuring new data cubes, or editing existing ones—an important part of the data visualization process.
Read the tutorial here.
How the Time Series Extension can Enable IoT Use Cases in Polaris
As a companion piece to the IoT time series analysis blog, this lesson, written by Solutions Architect Ben Hopp, utilizes Polaris’ time series features to visualize data from a home thermostat. Ben covers several key abilities, such as backfill and padding, and covers how to quickly chart time series data in an easy-to-understand visual format.
If you would like to learn more about the details of using the new time series tools in Imply Polaris, read Ben’s lesson here.
How to Execute Window Functions on Data Sketches
Window functions are a popular SQL feature, enabling users to run calculations over rows related to the current row—ideal for figuring out totals, rankings, and moving averages. Data sketches, as their name suggests, estimate various statistics (such as cardinality, frequency, or quintiles) without having to process the entire dataset, making them a very lightweight tool that won’t compete for resources or slow down other key operations, like queries.
Senior Solutions Architect Senthil Vallinayagam had the idea to combine the two to facilitate fast analytics and approximations across large volumes of data. In his longform article, Senthil provides three separate sample queries in order of ascending complexity, and explains how these two aggregations can reduce query times from well over 30 seconds to milliseconds.
Read Senthil’s lesson here.
How to Analyze Query Patterns with the Broker Log Parser
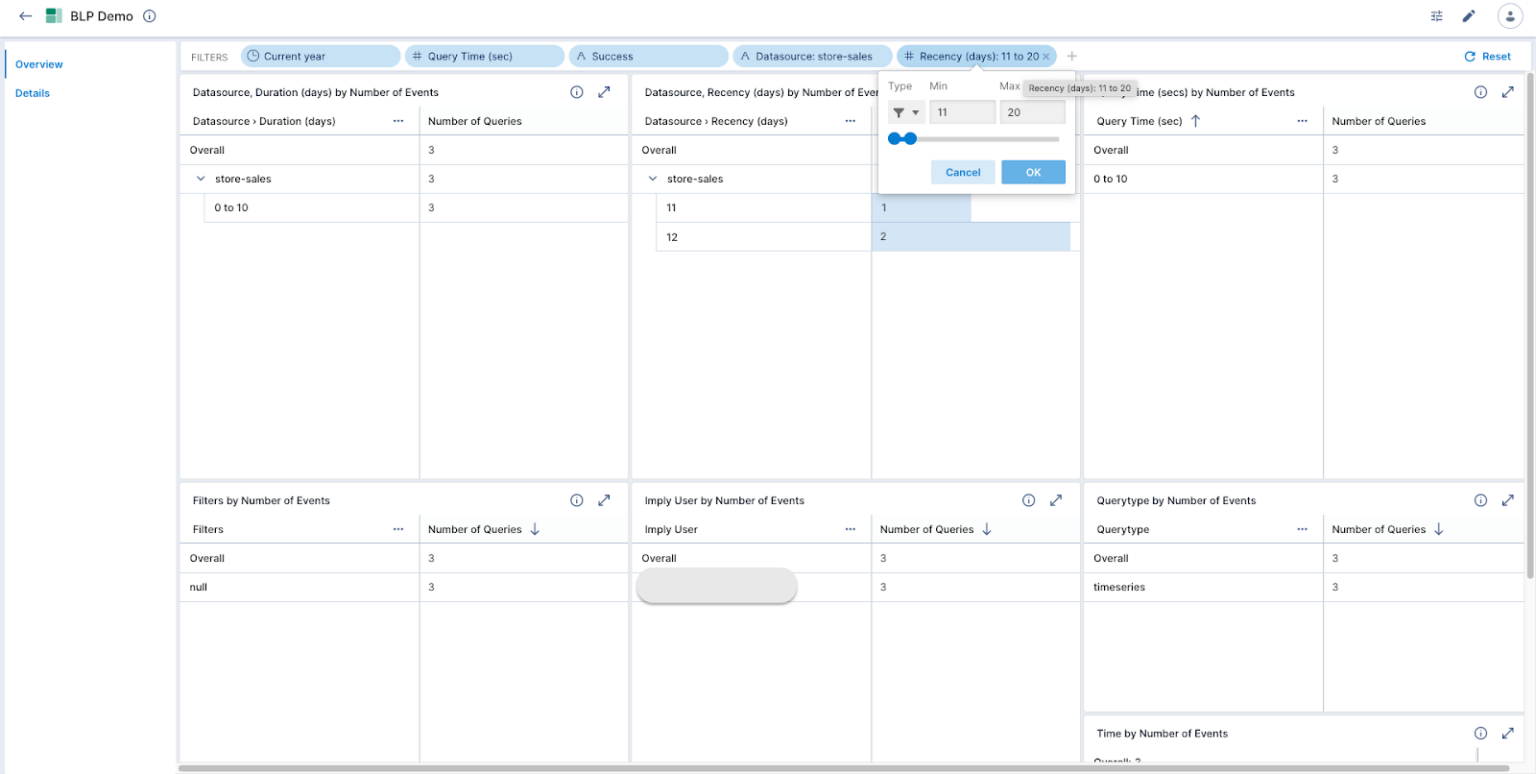
One of the unsung heroes of Apache Druid is the open source Broker Log Parser tool, which scans broker logs that contain details of all the queries in a cluster, and generates a CSV file with data such as QueryID, Query Duration, Filters, and more. This is essential for understanding query patterns, identifying possible bottlenecks, and ultimately, maintaining a high standard of query performance.
Figure 3. Ravin demonstrates how to filter out CSV data on an Imply dashboard.
To learn more, read Solutions Architect Ravin Trivedi’s tutorial on how to use the Broker Log Parser to analyze and optimize queries. Ravin even demonstrates how to ingest the CSV files into Imply, where you can build a datacube and dashboard to explore your data in greater detail.
Every month, the Imply team publishes new content on the Developer Center—and every season, we will recap the most popular blogs. Check back again in Winter for another rundown!
If you’re curious about Apache Druid, sign up for a free trial of Imply Polaris, the fully managed database-as-a-service—and the easiest way to run Druid.