Introducing Imply CrossTab: an infinite Excel PivotTable
Jan 25, 2021
Vadim Ogievetsky
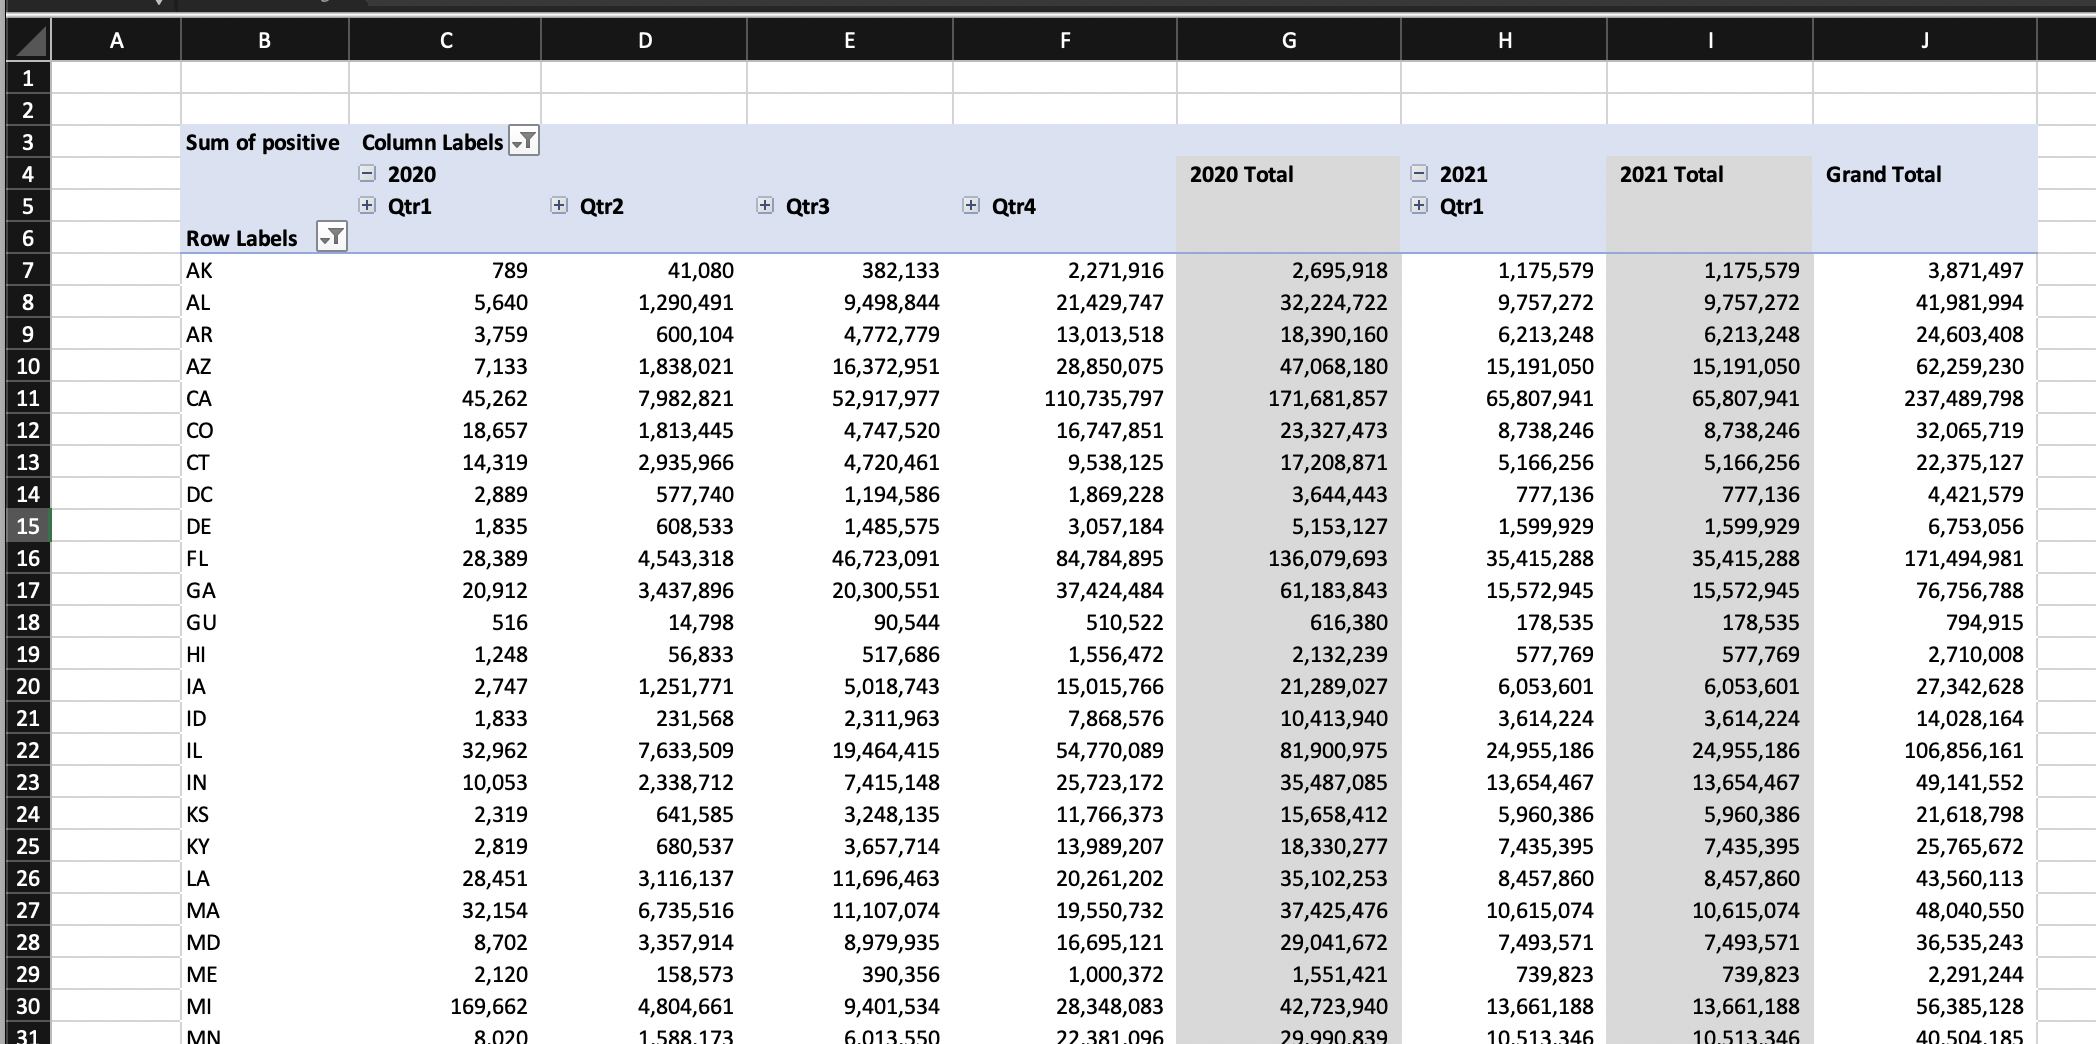
PivotTable (or CrossTab) views are a staple of data analytics software since their popularization by Microsoft Excel. The basics are very simple: you filter the data and drag dimensions into rows and columns to create a two dimensional grid of “cross-tabulated” values for every intersection. This simple yet powerful interaction model can give you extremely detailed insights, as long as your data set is reasonably sized such that the data can be visualized.
The PivotTable interaction model presents a unique set of challenges if you want to operate on data at scale. Specifically, if you keep adding more dimensions to the row and column axes, you will soon be interacting with a table with billions of cells. This can render PivotTables effectively non-functional due to the number of results that need to be crunched and displayed. To overcome this challenge, most tools place implicit or explicit restrictions on how many dimensions you can inspect, and on the maximum size of the results.
When we decided to build a CrossTab (beta) view at Imply, imposing limits on the total result size was not an option – people come to us when they hit limits on their existing tools. Instead, we decided to leverage one of the unique capabilities of Apache Druid: the ability to serve many small sub-second queries in rapid succession. Instead of loading the entire table result set, we load only what is seen on screen. As the user interacts with the view by expanding values and scrolling more cells come into view and get batched up, queued up, and loaded. Thanks to Druid, the loading feels instantaneous.
This “trick” is not new – ray tracing, an image rendering technique which traces the ray of visual light from each pixel to its source, has been around since the seventies. The reason this technique is not applied more commonly in the data analytics world is that most databases have large per query overheads, making it more appealing for the UI tools to issue one or more large queries to get all the data upfront.
Apache Druid was designed from the ground up to power interactive applications, which lets us think outside the box and re-imagine established analytical tools.
Crosstab is currently in beta, but we’d be happy to demonstrate it to you. Just let us know at imply.io/contact.
Other blogs you might find interesting
No records found...
Jun 16, 2025
10 Years of Imply: From Apache Druid to What’s Next in Real-Time Analytics
We’ve officially hit double digits! Ten years ago, a few Druid-obsessed engineers asked a radical question: What if analytics didn’t have to be slow, stale, or stuck in dashboards? Back then, we were just...
Real-Time Observability Without Operational Overhead: What’s Next?
Observability is meant to provide clarity, speed, and confidence in modern systems. Yet for many organizations, it has become a source of complexity, cost, and operational drag. Managing pipelines, tuning...
It’s Time to Rethink Observability: The Event-Driven Future
Observability has evolved. Forward-looking teams are already moving beyond static dashboards and fragmented telemetry—treating all observability data as events and unlocking real-time insights across their...