Blueshift: Scaling real-time campaign analytics with Apache Druid
Aug 08, 2019
Anuraj Pandey, Blueshift
Blueshift is an AI-powered customer data activation platform enabling CRM and product marketers to intelligently manage their audiences and orchestrate large-scale personalized messaging campaigns at scale. Blueshift offers real-time campaign analytics as a core capability in the platform. Campaign analytics break down engagement metrics like impressions, clicks, conversions, etc. by channel, trigger, experiment etc. Currently two billion+ user interactions are tracked on a monthly basis.
Druid at Blueshift
Previously we developed an in-house real-time campaign analytics engine on top of Redis and Postgres. Campaign metrics were aggregated with Redis in real-time for a predefined list of dimensions and a time slice. Pre-aggregated results were later stored in Postgres. This architecture solved the campaign-specific reporting requirements of the product. However, it was not designed to query on multiple dimensions. As our customer base and the internal team grew in size, we felt the need to revisit the architecture to power the following new use cases:
Measure the campaign performance on high cardinality dimensions like domain, UTM parameters, link positions, items, etc.
Measure impressions, unique conversions, total conversions, sum (revenue) to build automatic traffic allocation capabilities using Bayesian bandits
Cohort analysis over multiple dimensions
Internal reports to measure the impact of ROI of AI across different types of campaigns and industry verticals
We experimented with Druid and decided to use it to power our customer-facing analytics dashboard and internal ops dashboards.
Our journey so far
In December 2016, we decided to do a small POC on Druid. We deployed a Druid distribution packed by Imply in the Amazon Web Services (AWS) cloud using Packer, Chef, and Cloud Formation. We hooked up Druid with Kafka using Druid’s indexing service. There was a bit of a learning curve in understanding Druid, but a well-designed microservices architecture and detailed documentation made it fairly easy to customize Druid to our requirements.
A few months later, we decided to productize this cluster to power parts of our customer-facing dashboards (using a custom UI layer) and internal ops dashboards (using Apache Superset). We spent a few days of effort on hardening the infrastructure and tuning the settings to get the desired QPS performance on dashboard reporting. Fast forward to this date, our traffic has doubled but we have spent very little effort on operations.
In the rest of this article, we would like to share our guide and tips on scaling the Kafka ingestion pipeline with re-indexing and compaction.
Bye-Bye Lambda Architecture
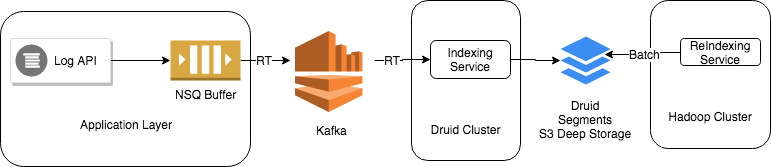
Our simple ingestion pipeline is shown in the following image.
Campaign events are ingested in real-time using Druid’s Kafka indexing service which guarantees exactly-once ingestion semantics.
The Kafka indexing service builds and keeps real-time segments available for query in real-time. Real-time segments and Kafka offsets are committed to deep storage and meta store respectively on a periodic basis as part of the segment’s hands-off process. The Kafka indexing service provides a tradeoff between how much real-time segment data is stored in memory vs. how frequently data is offloaded to deep storage.
To keep the segments produced by the Kafka indexing services to a few MBs and have a reasonable recovery time in case of job failures, we customize the Kafka indexing job spec as follows:
"granularitySpec": {
      "type": "uniform",
      "segmentGranularity": "DAY", /* bigger segment size */
      "queryGranularity": "HOUR", /* trade compaction in favor of query granularity */
    }
"taskDuration": "PT4H" /* right balance between the segment size and handsoff */
"completionTimeout":  "PT1H"
"lateMessageRejectionPeriod": "PT20H" /* more about it later */
Scaling the real-time segments
The Kafka indexing service tracks real-time segments for each partition in the Kafka topic to guarantee exactly-once semantics. This results in the creation of a large number of segment files, ~ on the order of the number of Kafka partitions as described in this guide.
Druid’s query performance is strongly influenced by the number of segments and segment size. A Druid query is distributed across historical and real-time nodes which assign one thread from its pool to each segment file. Having too many segments increases scheduling overhead which hurts query performance, while large segments decrease the parallelism and starve other queries. Maintaining an optimal segment size is critical to optimize query performance, as described here.
To maintain a segment size of roughly 400-600 MB, we run a daily Hadoop batch indexing job to merge smaller segments produced by the Kafka indexing job. This job is configured to replace the previous day’s segment files in deep storage with a larger segment file. While doing so, we use the following configuration to compact segments further:
"queryGranularity": "DAY", /* We don’t need hour level granularity after 24 hours */
"type": "hashed", /* Using a single dimension partitioning based on account_uuid could further improve the query performance for account heavy query patterns */
"targetPartitionSize": 5000000, /* To ensure optimal segment size */
The segment partitioning scheme in the Kafka indexing service is different from Hadoop batching indexing. The Kafka indexing service would fail if out-of-order events are observed for a time window where a real-time segment overlaps with re-indexed segments. To handle this scenario, make sure the Kafka indexing job rejects late messages to avoid the segment overlap. We set “lateMessageRejectionPeriod” to “PT20H”, and run Hadoop batch indexing every 24 hours (i.e after lateMessageRejectionPeriod has passed). If the indexing service Kafka producer is backlogged by more than lateMessageRejectionPeriod, it will start dropping events. We have setup alerts and scripts to deal with such issues.
We further enable compaction settings on the Druid coordinator. If daily segments are still smaller than the optimal segment size, the Druid coordinator will run a compaction task to merge continuous time interval segments until the desired segment size is met. Refer to http://druid.apache.org/docs/latest/design/coordinator.html#compacting-segments for more details.
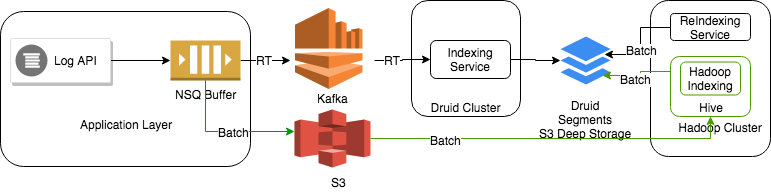
Backfill pipeline
Our data lake stores raw campaign data in Hive ORC format. To manage backfills and add new dimensions to the historical data, we have integrated Druid with our data lake built on HDFS and Hive using Hadoop indexing jobs. More recent versions of Hive integrate seamlessly with Druid using Hive-managed Druid tables.
Summary
Druid is a solid piece of software for large scale analytics. Although there is a steep learning curve, once set up properly, it doesn’t require a lot of ongoing maintenance.
Kafka indexing service provides exactly-once ingestion semantics.
The limitations of the indexing service (i.e small segments) can be solved by aggressive compaction and re-indexing.
No more batch jobs to overwrite real-time data, no more Lambda architecture.
Druid integrates well with your data lake to manage data backfills.
We’ll describe our operational guide on setting up and maintaining a Druid cluster on AWS in a separate blog post. Stay tuned!
Other blogs you might find interesting
No records found...
Apr 14, 2025
It’s Time to Rethink Observability: The Event-Driven Future
Observability has evolved. Forward-looking teams are already moving beyond static dashboards and fragmented telemetry—treating all observability data as events and unlocking real-time insights across their...
5 Reasons to Use Imply Polaris over Apache Druid for Real-Time Analytics
Introduction Real-time analytics is a game-changer for businesses that need to make fast, data-driven decisions. Whether you’re analyzing user activity, monitoring applications and infrastructure, detecting...
We are excited to announce the release of Apache Druid 32.0. This release contains over 341 commits from 52 contributors. It’s exciting to see a 30% increase in our contributors!
Druid 32.0 is a significant...