What’s new in Imply Polaris – Our Real-Time Analytics DBaaS
May 28, 2023
Matt Morrissey
What’s new in Imply Polaris – March 2023
Every week, we add new features and capabilities to Imply Polaris. This month, we’ve expanded security capabilities, added new query functionality, and made it easier to monitor your service with your preferred tools.
If you’re not familiar, let me give you a quick recap of what Polaris is all about. It starts with Druid-as-a-Service, with all the advantages of a fully managed cloud service plus additional built-in capabilities for data ingestion and visualization. It enables you to start extracting insights from your data within minutes—without the need to procure or configure any infrastructure. You can use the same cloud database to manage your data from start to scale, with automatic tuning and continuous upgrades that ensure the best performance at every stage of your application’s life.
Now for what’s new!
PrivateLink and VPC Peering for Pull Ingestion from Kafka
Data security is a top priority for us. At Imply, we go to great lengths to ensure the confidentiality, delivery, and availability of your data.
All data sent to Polaris is always TLS encrypted by default. Additionally, we’ve supported AWS PrivateLink for push-based ingestion from Apache Kafka® and other Kafka-compatible services. Now, we are extending those private networking options for pull-based ingestion. Specifically, Polaris can ingest data over AWS PrivateLink from customers’ Kafka clusters in AWS (Amazon MSK or open-source Apache Kafka). Customers who want to lower their data transfer costs can also choose VPC Peering for pull ingestion with Polaris.
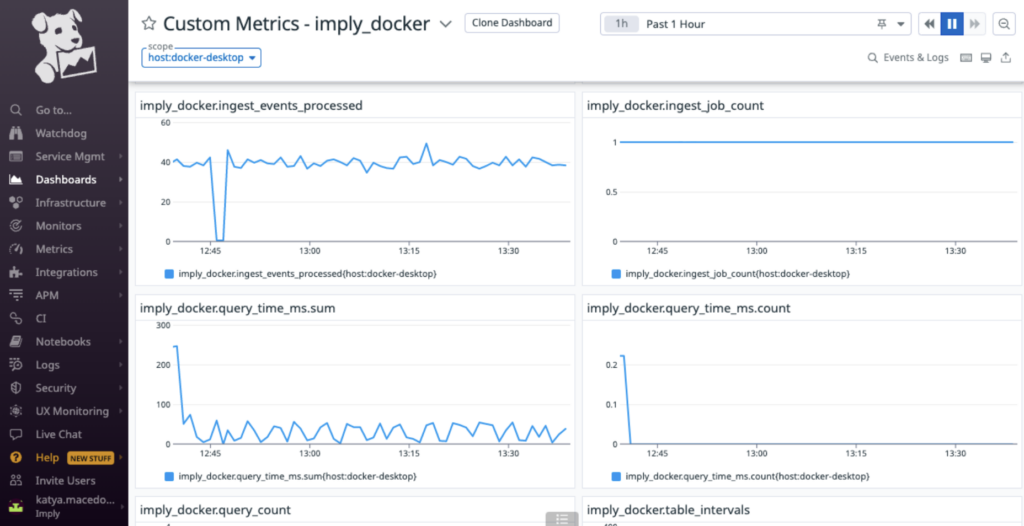
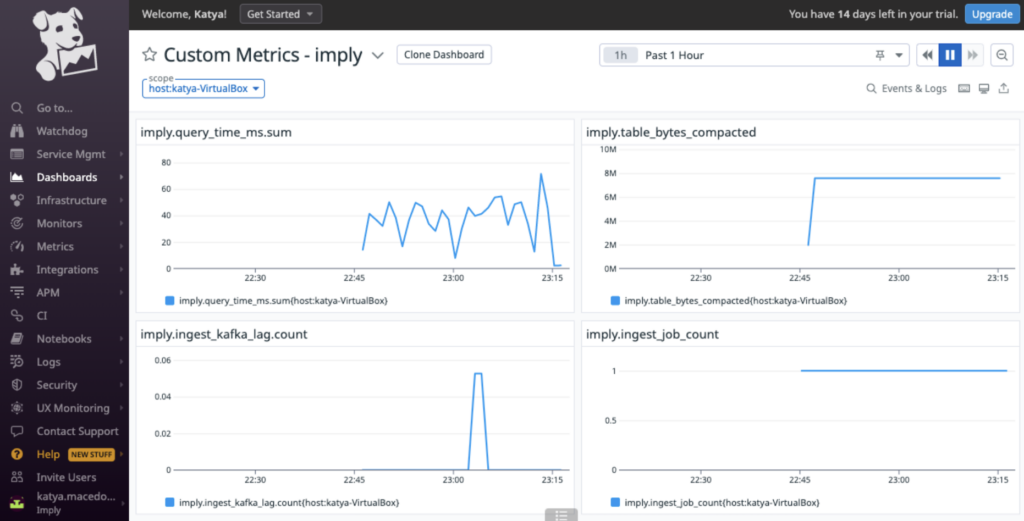
Easily Export Performance Metrics to Your Observability Tools
Imply Polaris offers built-in performance monitoring capabilities for query and ingestion performance metrics.
At the same time, we know that many of you already have observability tools in place to monitor your entire data pipeline. To help with improved integration, Polaris now provides an API that enables you to export performance metrics to your tool of choice such as Datadog, Prometheus, Elastic, or others. You can use the same dashboarding, querying, and alerting capabilities these tools provide, or you can use the Polaris built-in capabilities. Exporting performance metrics is as simple as:
curl --location --request GET 'https://ORGANIZATION_NAME.api.imply.io/v1/metrics/export' \--user ${POLARIS_API_KEY}:
New Query Capabilities for Timeseries
Since the foundation of Polaris is Druid-as-a-Service, it excels with time-series data and is a great fit for time-related queries.
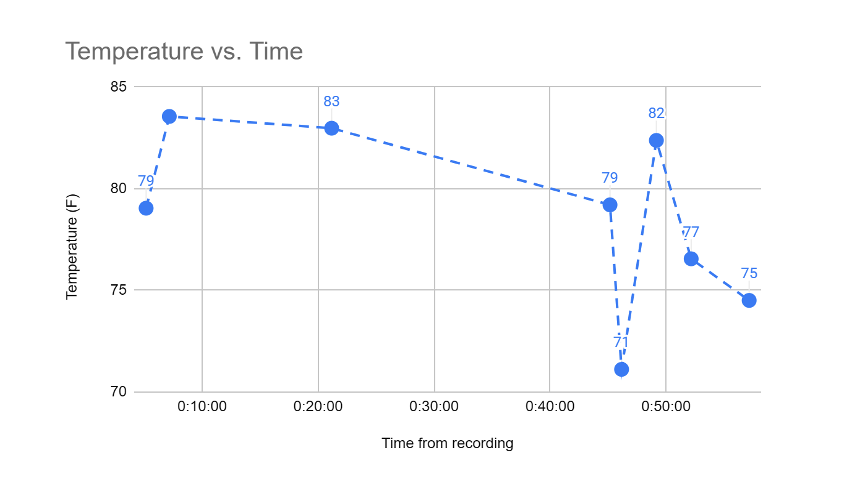
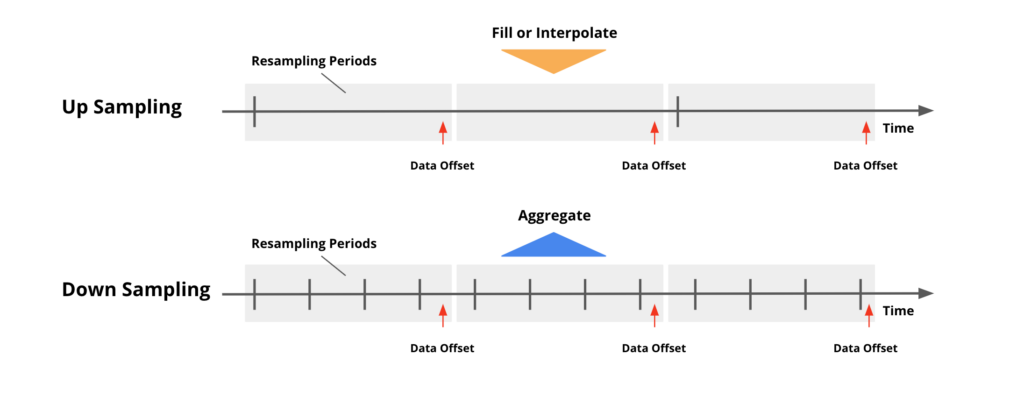
Now we’re adding more capabilities for time-series based analysis allowing developers to efficiently aggregate data for interpolations, padding, and time-weighted averages. One example is for IoT data, where the time-series sensor metrics are not always continuous. You can use the new time-series function to interpolate the data to help smooth out the data for downstream analysis.
In this example, the dashed line will be interpolated with the new time-series function where gaps between individual data points can be filled in to form a continuous pattern. You can also use this function in combination with other Druid functions to downsample and upsample time-series events.
New Query Capabilities for doing session analysis
As our journey towards building session analysis capabilities, we’re introducing Sampled GROUP BY.
In the following example, we want to do an analysis of what % of Wikipedia contributors are adding content vs. deleting content. We define this as the average contribution for a given user over many contribution events. As you can imagine, this will be millions of users, each with thousands of edit events, and can be quite expensive to compute. However, statistics tell us, if we look at 5000 randomly selected users and do an analysis of their edit history, it should give us a pretty good idea of what the overall Wikipedia contributors are doing.
SELECTcount(*) FILTER(WHERE average_contribution >0) / ANY_VALUE(s) as adding_contributors,count(*) FILTER(WHERE average_contribution <=0) / ANY_VALUE(s) as deleting_contributors,count(*) / ANY_VALUE(s) as total_usersfrom (SELECT user, avg(delta) as average_contribution, SAMPLING_RATE()as s from Wikipedia GROUP BY1) TABLESAMPLE SYSTEM(5000rows)
What’s cool about this feature is the SAMPLED GROUP BY query will automatically ensure all events matching the sampling column (e.g. user) will be included so that you don’t have to do this using subqueries and filters.
With the sampling capability, you can do a lot more complex queries on large datasets that weren’t feasible. For example, understanding user cohorts, computing conversion funnels, or looking at average video watch times to name a few examples.
Dual Axes Visualization
Polaris as a database service also includes data visualization capabilities. This month we have further expanded those capabilities by enabling users to create graphs with two different axes. Now you can easily illustrate the relationships between two variables with different magnitudes and scales of measurement.
The nice thing about a dual-axis chart is that it illustrates plenty of information using limited space, so you can discover trends you may have otherwise missed.
Some examples include:
Understand trend relationships between unique users in Germany vs. the World
Understand how changes in network utilization (a point in time metric) is related to storage utilization (a cumulative metric)
Understand how ad impression is impacting user conversion, as two distinct values with different units of measurement
Easily automate data ingestion
Today, there are two ways to ingest data into Polaris: you can do it interactively with the Polaris UI, or you can do it programmatically using the Polaris API. Most of our users start with sample ingestion via the UI and then want to convert the sample into code so it can be automated for production.
Now, you can easily re-use the sampled ingestion spec through the API by copying the generated spec from the UI.
Learn more and get started for free!
Ready to get started? Sign up for a free 30-day trial of Imply Polaris—no credit card is required! As always, we’re here to help—if you want to learn more or simply have questions, set up a demo with an Imply expert.
Other blogs you might find interesting
No records found...
May 07, 2025
Real-Time Observability Without Operational Overhead: What’s Next?
Observability is meant to provide clarity, speed, and confidence in modern systems. Yet for many organizations, it has become a source of complexity, cost, and operational drag. Managing pipelines, tuning...
It’s Time to Rethink Observability: The Event-Driven Future
Observability has evolved. Forward-looking teams are already moving beyond static dashboards and fragmented telemetry—treating all observability data as events and unlocking real-time insights across their...
5 Reasons to Use Imply Polaris over Apache Druid for Real-Time Analytics
Introduction Real-time analytics is a game-changer for businesses that need to make fast, data-driven decisions. Whether you’re analyzing user activity, monitoring applications and infrastructure, detecting...