As the volume of log data continues to rise, even great observability solutions force tough trade-offs: rising license fees, limited retention windows, and slow searches caused by archived data.
That’s why leading teams add Imply Lumi. Lumi is the industry’s first Observability Warehouse—a modern, drop-in data layer that lets you do more with your existing observability tools.
With Lumi, you can:
- Keep Splunk workflows intact (no retraining or migration).
- Cut Splunk storage costs by offloading logs into Lumi without filtering or dropping data.
- Search years of data instantly—no more rehydration delays.
In this quickstart, you’ll see just how easy it is. Using a sample dataset, we’ll upload logs into Lumi, explore events, and run queries.
Why add a drop-in data layer for Splunk?
Traditional observability platforms like Splunk force tough decisions. Teams often have to:
- Discard data to control ingest costs.
- Shorten retention to keep storage affordable.
- Wait minutes (or hours) to rehydrate cold data.
By adding Imply Lumi as a drop-in data layer, you avoid all three.
You can:
- Store all logs affordably.
- Run sub-second queries across all data.
- Keep all existing Splunk dashboards and alerts.
Think of Imply Lumi as a cost-optimized, high-performance warehouse for your Splunk logs.
Step 1: Download a sample Splunk-style dataset
We’ll start with a Lumi-compliant CSV that simulates real Splunk log data: a few hundred rows of web traffic from a fictional online store.
[Download the file: site_visitors_quickstart.csv]
The dataset includes familiar web log attributes: user, URI, host, and method.
Step 2: Upload logs into Lumi
In the Lumi UI:
- Go to Integrations → File upload.
- Select the CSV. Lumi auto-previews the file.
- Leave optional fields blank for now — Lumi handles schema inference.
- Click Upload, then Go to Explore.
Within seconds, your logs are ready to analyze — no agents, no schema mapping, no pipeline rewrites.

This is the same seamless process you’ll use when extending Splunk with your real data pipelines.
Lumi accepts data from Splunk forwarders, Cribl, or OpenTelemetry, preserving sourcetypes and field metadata so everything stays consistent.
Step 3: Explore events in Lumi
The Explore view shows your uploaded logs, scoped to the last 7 days. Customize the view just like you would in Splunk:
- Add user to see activity by individual visitors.
- Add uri and host to see what pages were hit and by which server.
- Add method to see request patterns.
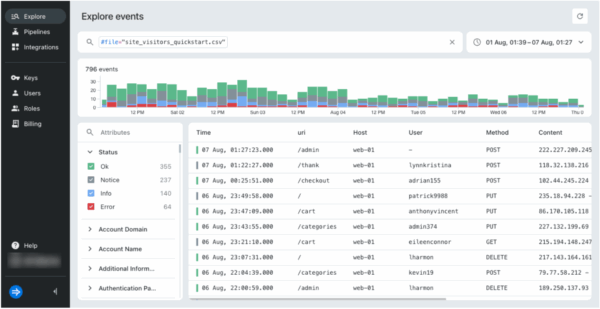
Because Lumi structures your logs on ingest, every field is immediately query-ready.
The result: your raw logs instantly become structured events you can search and visualize with no changes to your workflow.
Step 4: Run Splunk-style queries (faster)
Lumi’s search syntax will feel instantly familiar if you use Splunk today. Try a few examples:
-
uri=/trending host=web-01
→ Show traffic to the trending page.
-
user IN (sallyosborne,mialim,rocketsmith)
→ Filter activity by user.
-
uri!=/register
→ Exclude registration page hits.
-
(uri=/config* AND user=shawkatherine) OR method=POST
→ Combine filters for nuanced investigations.
-
#status=notice
→ Find events by system status code.
Lighting fast query runs – even across full datasets. No waiting for archives. No dropped data.
Since Lumi appears as a Splunk-compatible federated source, you can run these same queries directly from the Splunk UI.
The result extends your existing dashboards and alerts with faster, deeper search.
What this means for Splunk users
This quickstart shows that Lumi is the fastest way to extend Splunk without disruption:
- Splunk + Lumi = Full visibility → keep years of logs searchable.
- Lower Splunk TCO → offload data.
- No workflow changes → dashboards, alerts, and saved searches continue working as they do today.
- Future-proof architecture → run Lumi alongside Splunk, then expand usage across Grafana, OpenTelemetry, or AI copilots as your observability needs grow.
Splunk remains your trusted interface — Lumi simply powers it with speed, scale, and affordability.
Next steps: Splunk without trade-offs
In just a few minutes, you saw how Lumi can:
- Upload logs instantly.
- Explore structured events with no friction.
- Run Splunk-style queries in sub-seconds.
Now, imagine querying your event data in Lumi directly from Splunk. See How to search events with Splunk to see how you can:
- Connect Splunk to Lumi
- Query Lumi events from Splunk
See How to convert a Splunk dashboard to use your existing dashboards in Splunk against Lumi — no workflow changes, no trade-offs.
Keep Splunk. Add Lumi. Stop compromising.
Book a demo and see how easy it is to add Lumi as a new data layer for observability.
 Jill Osborne