Observability, crucial for managing modern cloud workloads and microservices, is a framework that enables the understanding and optimization of complex systems. With the surge in microservices architectures, traditional monitoring tools struggle to interpret the vast data generated.
Observability offers a means to derive insights from this data deluge. This article will discuss two of the foundational pillars of observability: metrics and logs.
Metrics provide quantitative data on system performance and behavior, while logs offer detailed records of events and actions. By integrating these foundations, observability provides a comprehensive understanding of system behavior, facilitating effective troubleshooting and optimization.
Many organizations scrape metrics into Prometheus and analyze them via Grafana. This common approach is frequently constrained by Prometheus’s challenges with high cardinality data, short data retention, and limited analytic capabilities.
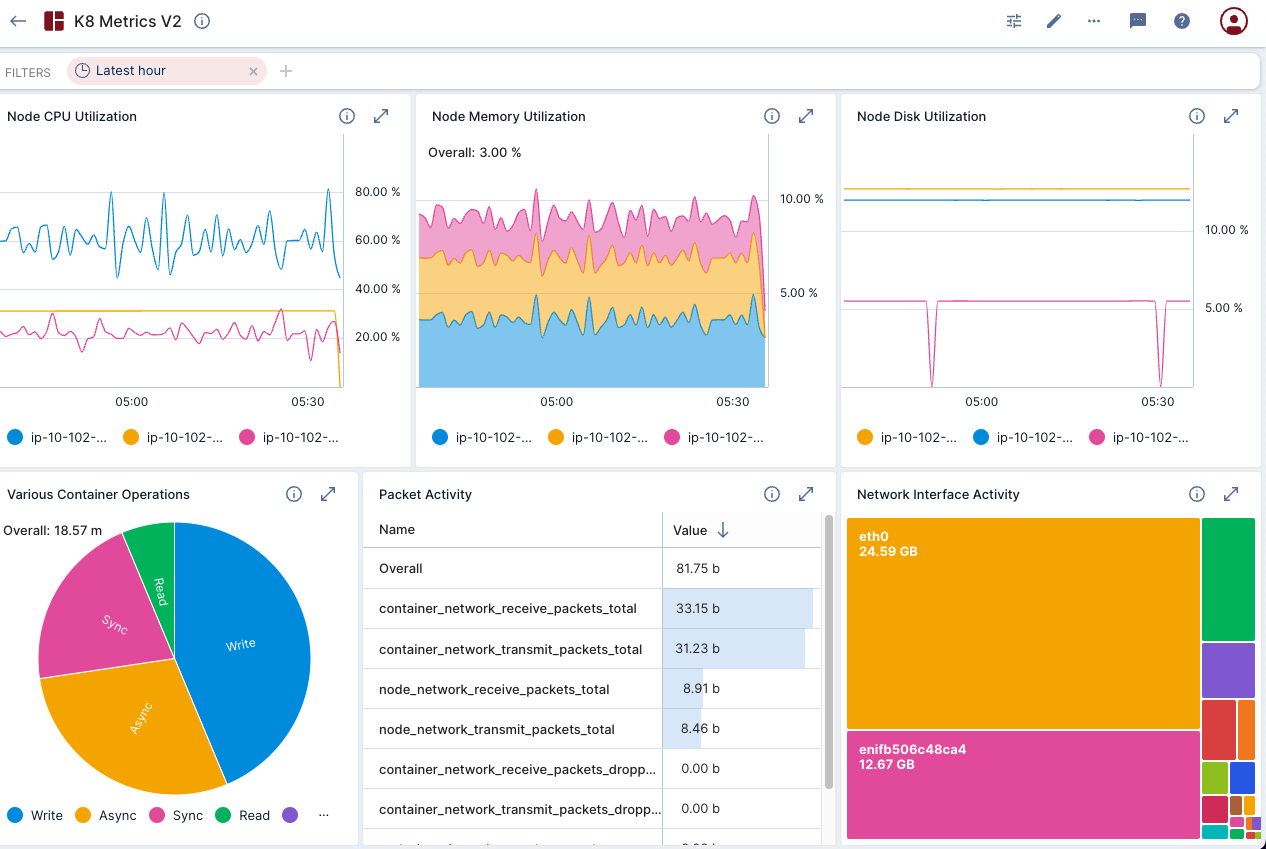
Imply offers a single pane of glass for your metrics, including a fast, ad-hoc visualization layer (pictured below) and an underlying database built for high performance on high volume, high cardinality data. This blog post will show you how to achieve fast, robust, and beautiful visuals on your Prometheus data without being limited by the cardinality of your labels.
Why is Observability Hard?
Given the intricate nature, vast scale, and ever-changing landscape of modern computing environments, achieving observability poses a set of significant challenges.
- Complexity of Systems: Modern computing environments often involve complex distributed systems, microservices architectures, and cloud-based infrastructure, which can be challenging to monitor comprehensively.
- High Volume of Data: With the proliferation of microservices, containers, and other dynamic infrastructure components, the volume of monitoring data generated can be overwhelming, making it difficult to extract meaningful insights.
- Diverse Data Types: Observability requires monitoring various types of data, including metrics, logs, and traces, each with its own format and characteristics, complicating the analysis and correlation of information.
- Dynamic Nature: Systems are constantly changing and evolving, with new services deployed, configurations updated, and code changes introduced regularly, making it challenging to maintain visibility and understand system behavior over time.
- Tooling and Integration: Selecting and configuring the right monitoring tools and integrating them effectively with existing systems can be complex, requiring expertise and resources.
- Scalability: As systems grow in scale and complexity, ensuring observability scales alongside them becomes increasingly challenging, requiring careful planning and infrastructure management.
In this blog, we would like to share the prevailing architecture for both metrics and logs, and discuss how Imply can help overcome some common obstacles.
The Prevailing Architecture
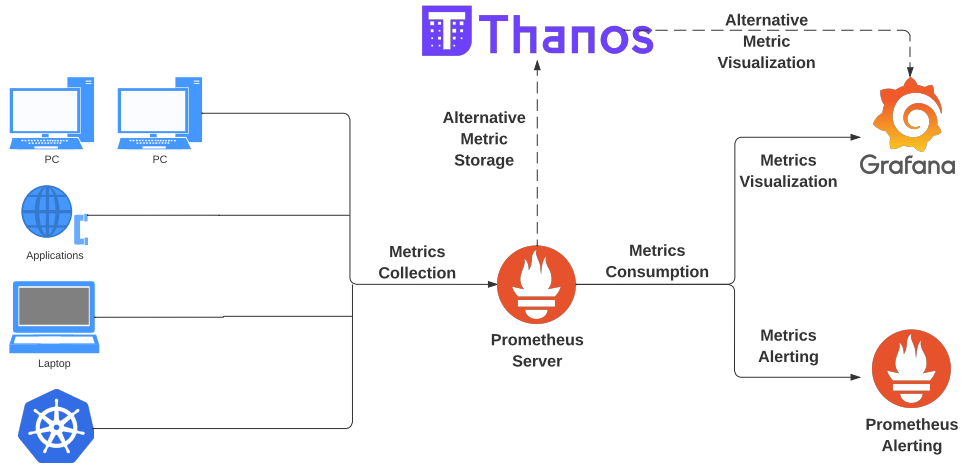
Metrics Architecture
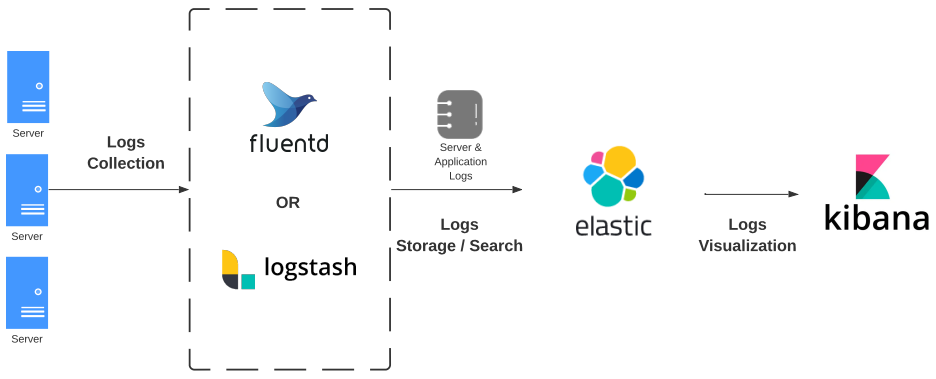
Logs Architecture
Challenges
High Cardinality
- High cardinality metrics data in Prometheus creates a risk of out of memory issues and overall performance degradation. As a result, system administrators end up needing to filter out potentially useful system telemetry, thus limiting analysis.
No single pane of glass
- Users need to get trained on two dramatically different UIs for metrics vs. logs
- Cross-referencing metric and logs data is difficult. Tools like Loki can put both logs and metrics under Grafana, but its memory-intensive design doesn’t scale for large amounts of historical data.
Short Retentions
- Observability teams are constantly needing to deal with the volume of data being captured in order to control costs.
- Limited local storage in Prometheus makes it necessary to be highly selective about the data stored. Metrics can only be kept for up to weeks at most because local storage is not clustered or replicated in Prometheus, nor is it durable in the face of drive or node outages. Backups require snapshots and raid architecture.
- Thanos can retain older data at the cost of lowering rollup granularity.
Limited Analytics
- Both PromQL and Kibana are easy to use for basic logics but get complicated very quickly for more advanced query patterns.
- Advanced analytical queries are oftentimes not performant.
Lack of Priority Access
- Both Prometheus and Elastic are prone to letting one bad query, a query across high cardinality dimension(s), and/or a long running query bring down the entire cluster, which is a problem for large deployments with many users.
- There is no support for “lanes,” which could be used to dedicate resources to mission critical users, consumers, or applications.
How Imply Helps
Architecture with Imply
Here is an end-to-end Imply deployment supporting both metrics and logs:
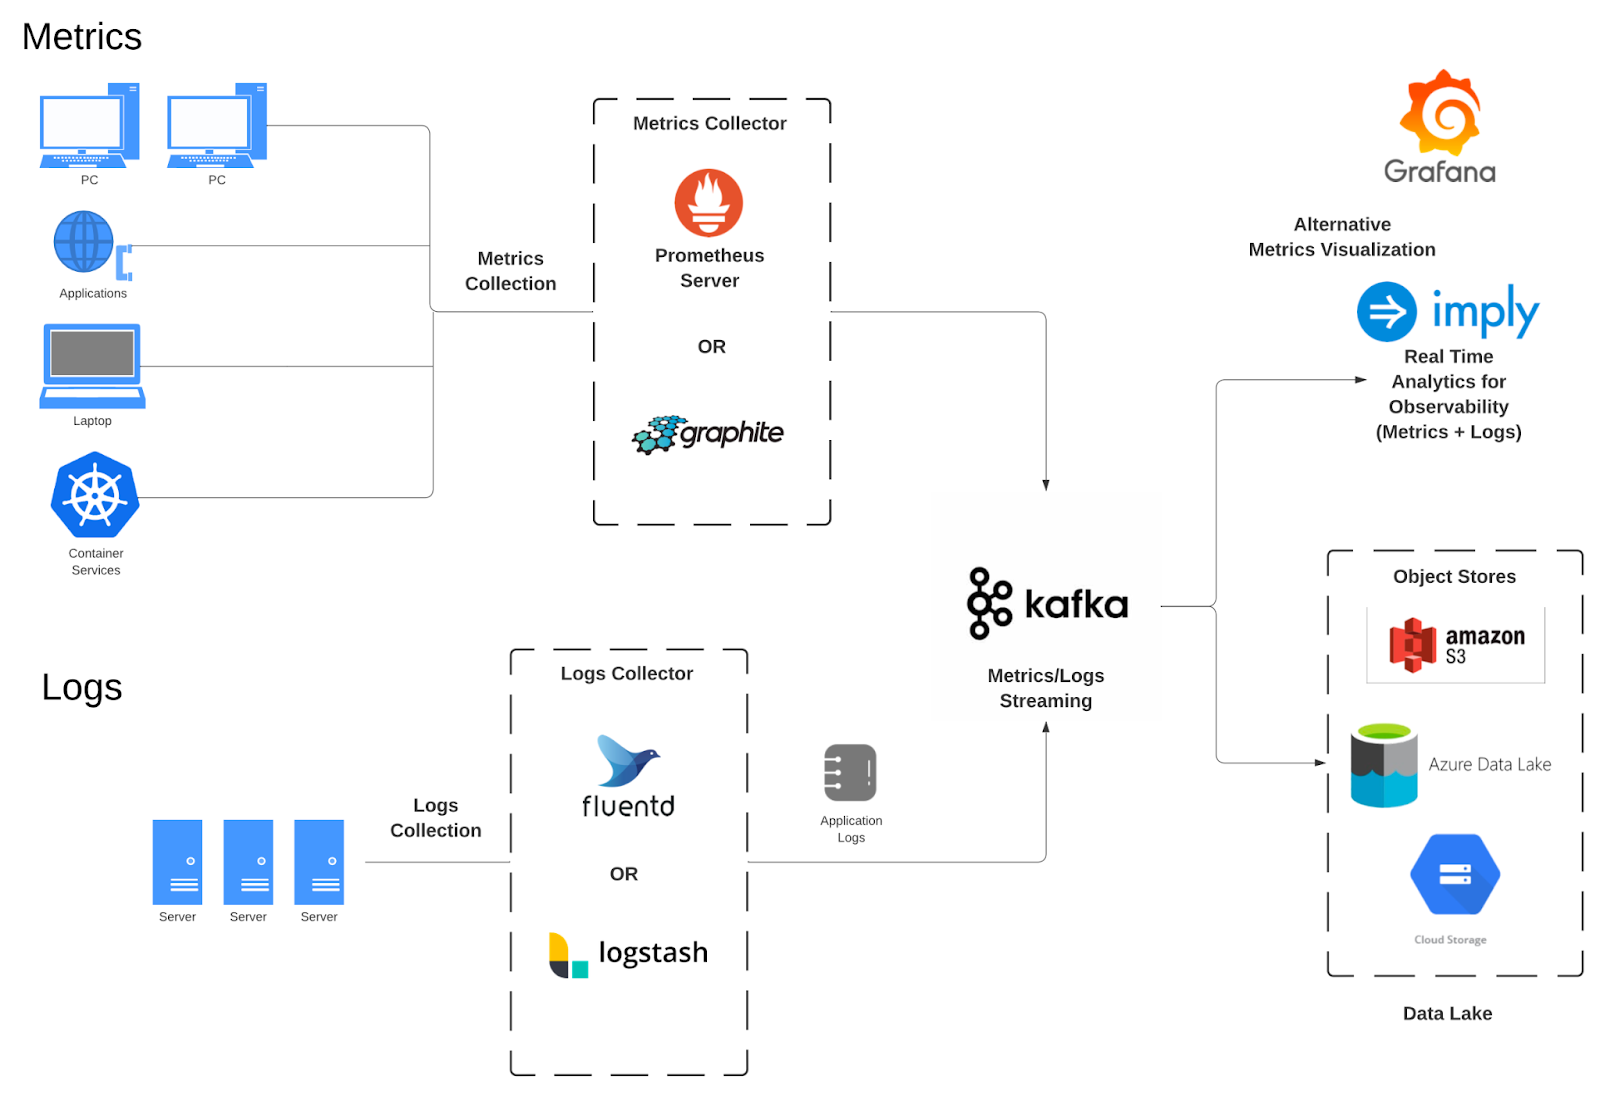
In this architecture flow:
1) Prometheus libraries capture metrics from devices or Kubernetes resources and push them to Prometheus.
2) Prometheus writes its data to Kafka.
3) Imply Druid reads and ingests the data.
4) Analytics applications query Imply Druid to support long-range, high performance analysis of the data.
Advantages with Imply
Single pane of glass for metric and log data, both realtime and historical
- Imply can enable analysis of metrics with logs side-by-side in a single analytical interface, enabling root cause analysis.
- Imply supports both realtime (sub-second) and historical (months to years) analysis for both metrics and logs.
Horizontally scalable with consistent high performance
Imply is a highly scalable distributed platform that supports consistent, ultra high performance for analytical use cases.
Fast, ad hoc analytics
- Imply supports full SQL on real-time data from Kafka with an average lag of under 100 ms.
- Query across terabytes of data in subsecond time.
- Data may be stored for days, months or years, based on configurable retention policies.
- Automatic ability to quickly compare data from different time periods, such as day-over-day, week-over-week, month-over-month and today vs the same day last month.
It becomes very easy to derive further insights from your data. Your exploration might start with a Grafana alert, or you might just be interested in understanding trends in your system. Now, you can quickly understand when trends are problematic or isolate deeper reasons behind anomalies in your data.
How To Set Up Metrics Collection from Prometheus
This post will cover setting up metrics collection from Prometheus, and future blogs will go over the log collection details.
Enhancing an existing Prometheus-based monitoring system with Imply requires adding Kafka, the Prometheus-Kafka adapter, and Imply. In the steps below, we will show you how to configure the Prometheus Exporter to write data to an existing Confluent Cloud Kafka topic. From there, you will connect to Confluent Cloud Kafka from Imply’s Polaris SaaS offering, read data from the topic and experiment with data visualization in Imply.
Set up Prometheus Kafka Adapter
In this set of steps, we install and configure the Prometheus Kafka Adapter to write to an existing Confluent Cloud Kafka cluster. If you do not have a Confluent Cloud account, you can sign up for a free trial at https://www.confluent.io/get-started/. You will need to create a cluster and a topic using the directions on the Confluent Cloud web site. (Trust us. It’s easy.)
- Download the tar file for Prometheus Kafka adapter.
wget https://github.com/Telefonica/prometheus-kafka-adapter/archive/refs/tags/1.9.0.tar.gz
tar -xvf 1.9.0.tar.gz
mv 1.9.0.tar.gz prometheus-kafka-adapter- Install Docker and Docker-compose
sudo yum update
sudo yum install docker
sudo systemctl enable docker
sudo systemctl start docker

sudo curl -L https://github.com/docker/compose/releases/latest/download/docker-compose-$(uname -s)-$(uname -m) -o /usr/local/bin/docker-compose
sudo chmod +x /usr/local/bin/docker-compose
docker-compose version- Configure docker-compose.yml. In this case, we’re writing to the imply-eks-metrics kafka topic
services:
  prometheus-kafka-adapter:
    image: telefonica/prometheus-kafka-adapter:1.9.0
    environment:
      KAFKA_BROKER_LIST: pkc-4nym6.us-east-1.aws.confluent.cloud:9092
      KAFKA_TOPIC: imply-eks-metrics
      SERIALIZATION_FORMAT: json
      PORT: 8080
      LOG_LEVEL: debug
      GIN_MODE: release
      KAFKA_SECURITY_PROTOCOL: SASL_SSL
      KAFKA_SASL_MECHANISM: PLAIN
      KAFKA_SASL_USERNAME: "<<redacted>>"
      KAFKA_SASL_PASSWORD: "<<redacted>>"
    ports:
- "8080:8080"- Run Prometheus Kafka adapter container
docker-compose up -d- Verify that the container is running
sudo docker ps- In order for Prometheus to send metrics to the Prometheus Kafka adapter, you need to configure Prometheus to use the adapter as a remote write endpoint in its configuration (prometheus.yaml). In our case, the adapter is running on the same machine as Prometheus Server. If you are running it on a different machine, replace localhost with machine ip.
remote_write:
- url: "http://localhost:8080/receive"- Restart Prometheus if you have set it up as a systemd service. — OR —
sudo systemctl restart prometheusb. Or if you are running it on a K8s cluster using Helm, run a helm upgrade after updating the prometheus.yaml values file. Here is how that would be done in AWS:
helm upgrade prometheus prometheus-community/prometheus \
    --namespace prometheus \
    --set alertmanager.persistentVolume.storageClass="gp2" \
    --set server.persistentVolume.storageClass="gp2" \
    --set server.service.type=LoadBalancer
    --values prometheus.yaml
You should now see metrics flowing from Prometheus to Kafka
Configure Imply Polaris to Read from Confluent Kafka
Next, we will set up Imply Polaris to ingest data from Kafka. If you do not have a Confluent Cloud account, sign up for a free trial.
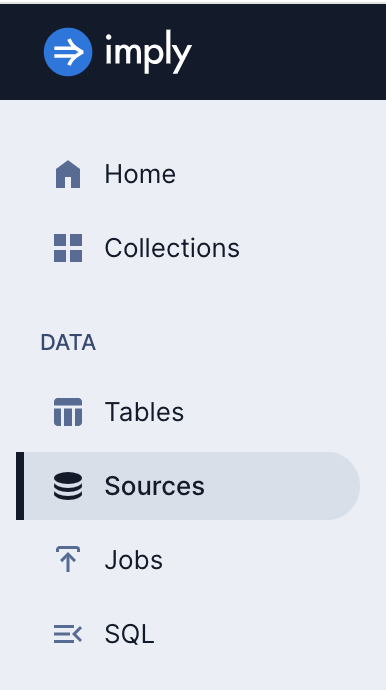
Once you are in the Imply Polaris environment, click on the Sources tab on the left toolbar.
At the top right, click Create Source and select Confluent Cloud.

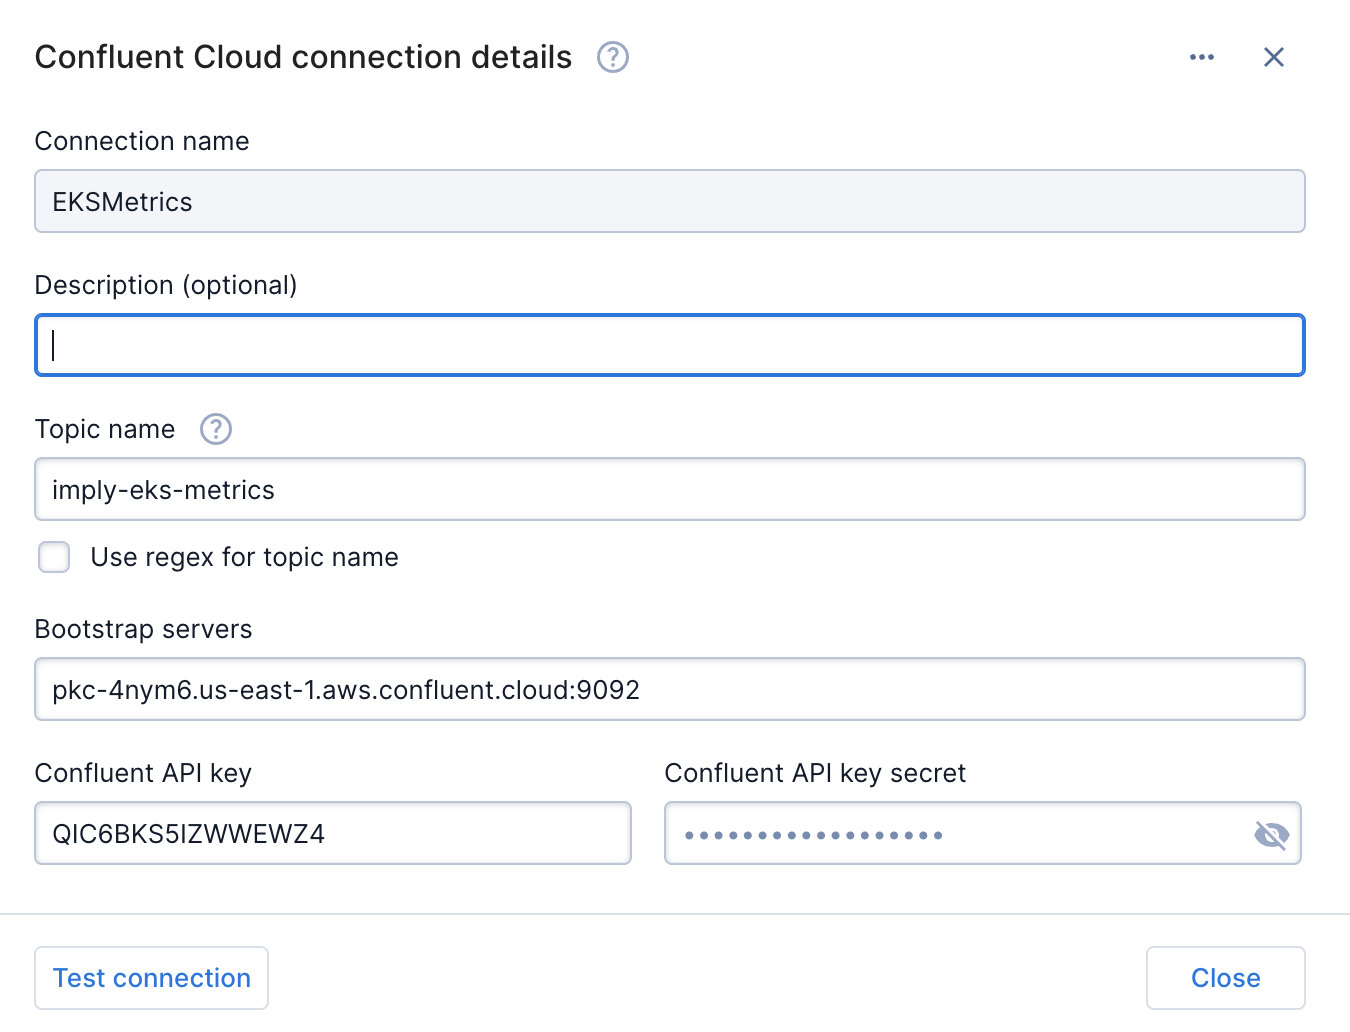
Now let’s create a connection to our Confluent Cloud environment. Configure the source relative to your Confluent Cloud environment. Test the connection to make sure it works. Then press the Close button.
Please note that the Confluent API key and the Confluent API key secret are equal to the KAFKA_SASL_USERNAME and KAFKA_SASL_PASSWORD that you specified in step 3 above.
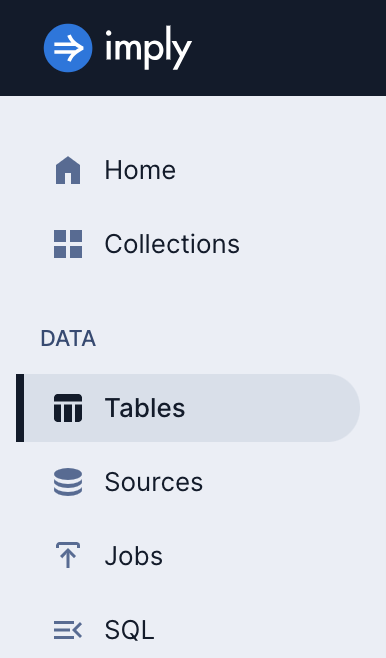
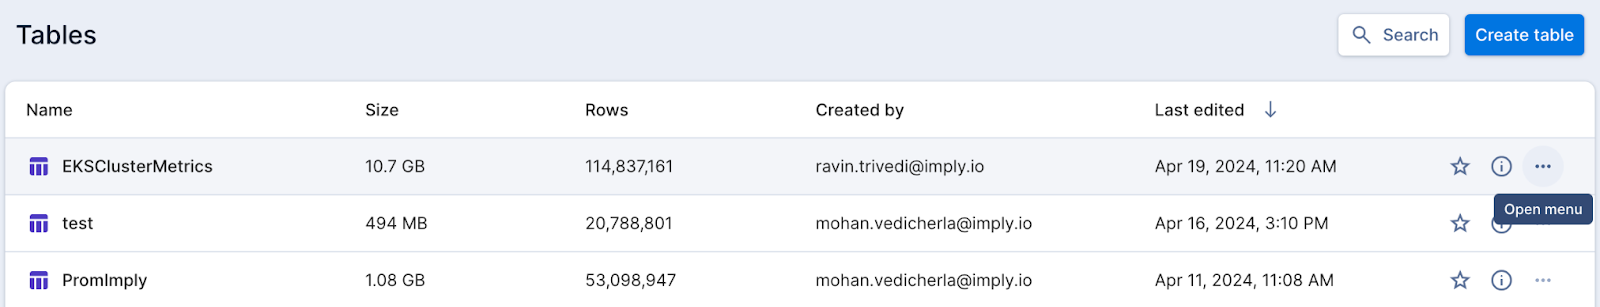
Let’s create a table to ingest the data from Kafka. Click on the Tables tab on the left toolbar.
Click the Create table button on the top right.

Give the table a name. We’ll call it EKSClusterMetrics. The Table type can be “Detail” and the Schema mode can be “Flexible”.
That means the data will be ingested at the lowest level of detail. If the schema of the incoming stream changes, Imply will automatically incorporate the changes. For example, a new column added to the stream will result in a new column added to the table.
Click Next.

You should be at the screen shown below. Click on the Load Data dropdown at the top right and then select Insert Data.

Select Confluent Cloud. Then select the EKSMetrics connection. That means we want to load data from the Kafka topic and cluster defined in the connection into our EKSClusterMetrics table. Click Next at the top right.

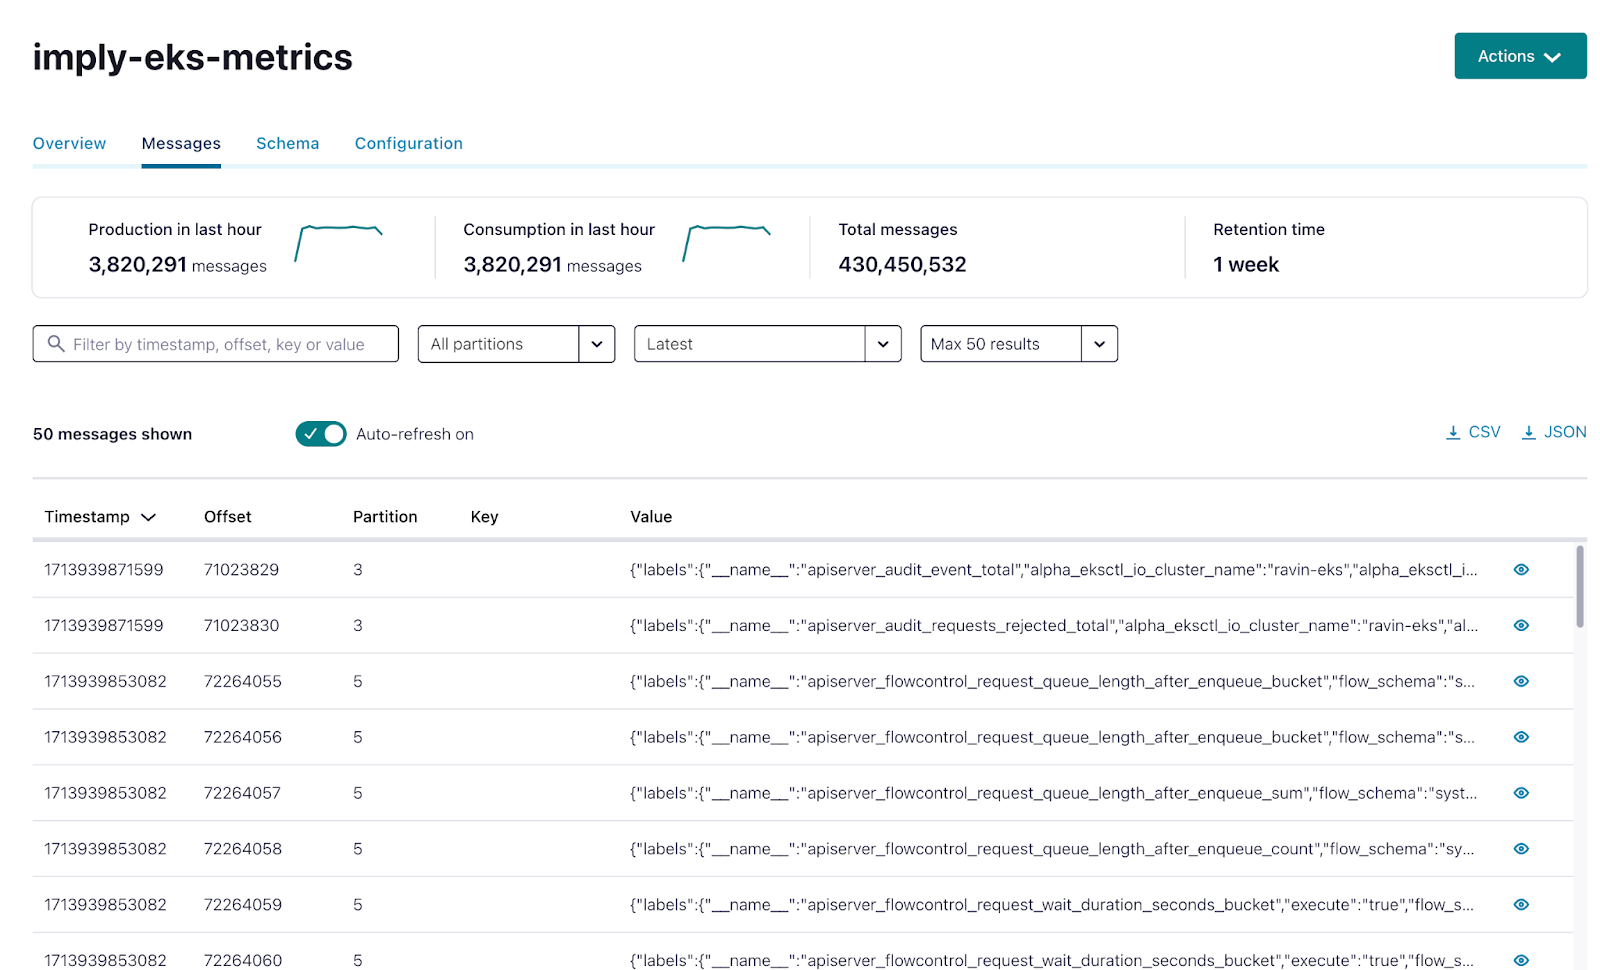
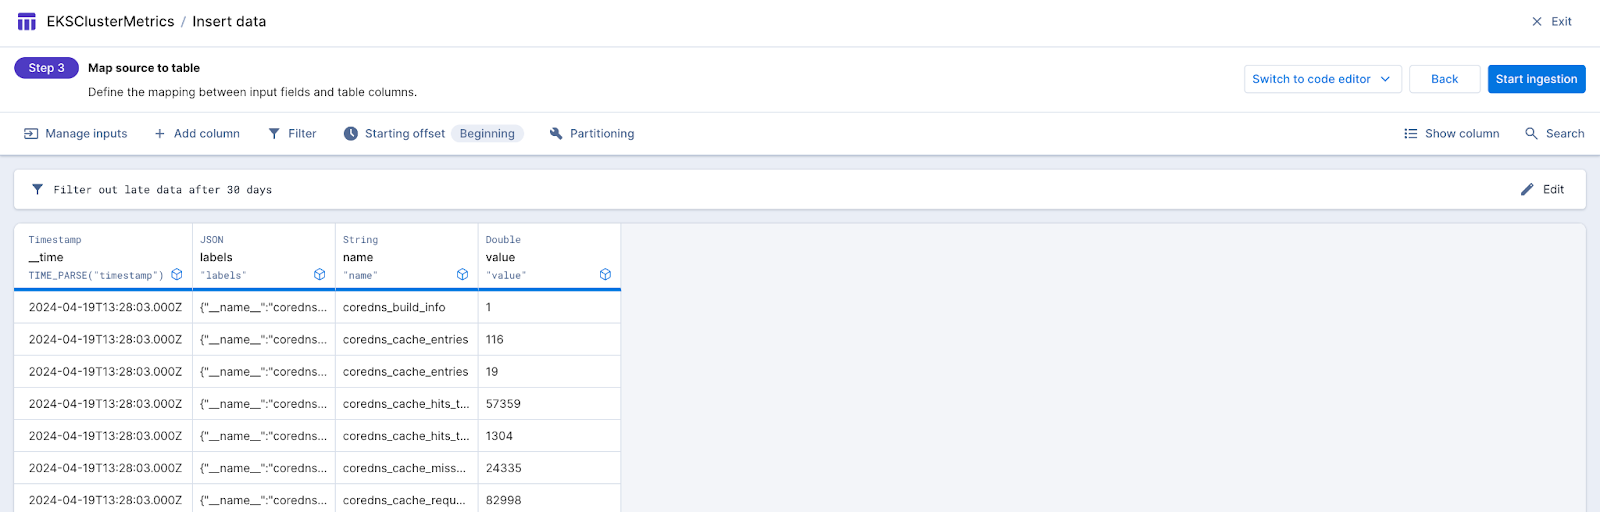
In a few seconds, you will see sample data from the Kafka topic. The data includes the event timestamp from the source system, the label of the data, the name of the data and its value. This is all coming from the source systems via Prometheus. Press the Continue button at the top right.
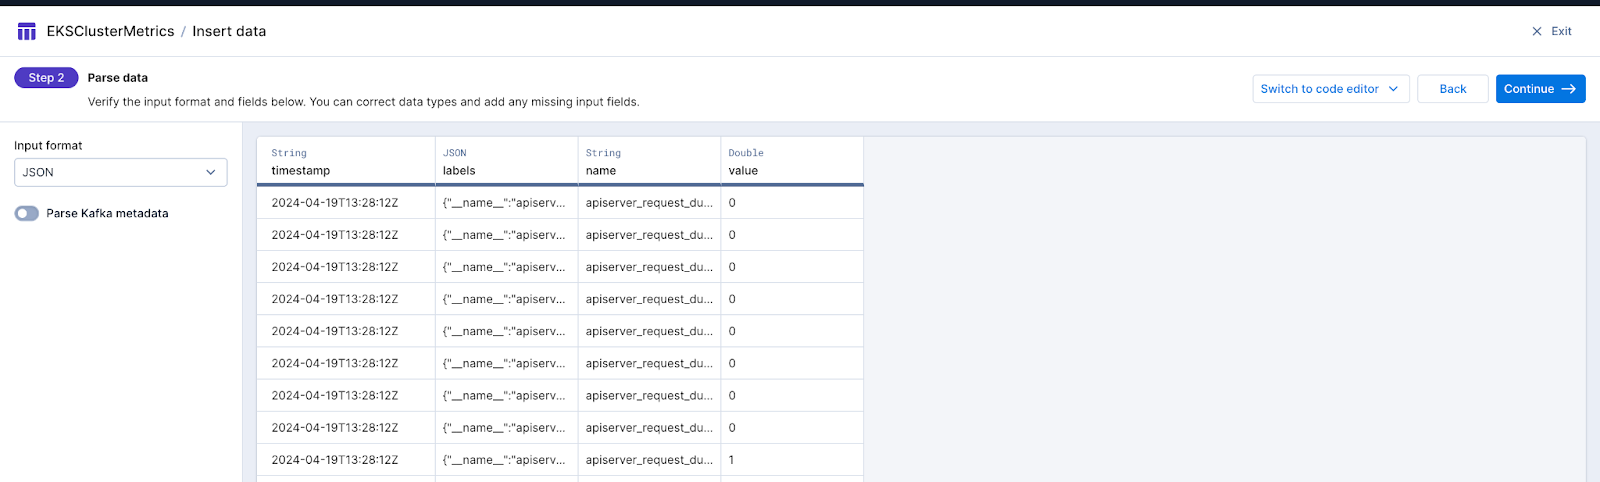
At this point, if we like, we can start parsing out the json column and perhaps make other transformations. Let’s keep things simple and click the Start ingestion button at the top right so we can start getting data in our table and analyzing it.
Once you start seeing data on the page, you’re ready to start exploring the data further. Let’s start by running some simple sql statements. Click on the Query button and then select SQL console. You will end up at a page like this. Go ahead and click Run to run the sql statement.
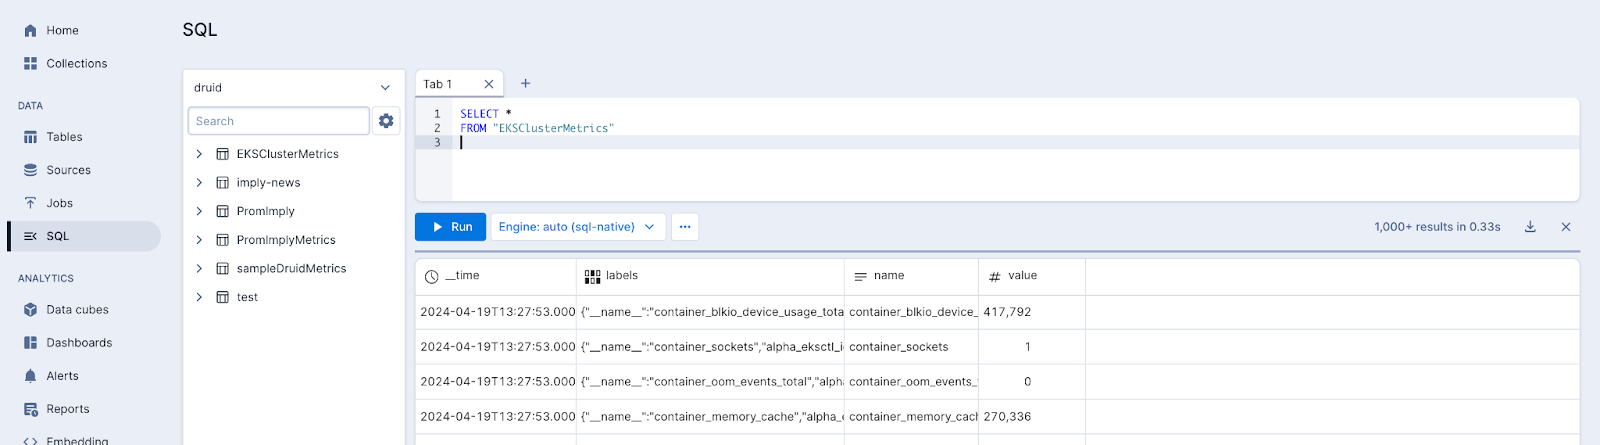
If you get results, your data is being ingested from Kafka and is queryable. You have some options for querying tools. For instance, you can connect from Tableau Desktop, Looker, Superset or Grafana.
Imply also has a built-in visualization capability set that was specifically designed to work well with Druid, available for free with Imply Polaris. Learn more here.
Visualize Your Data
Let’s go ahead and experiment with the visualization capabilities.
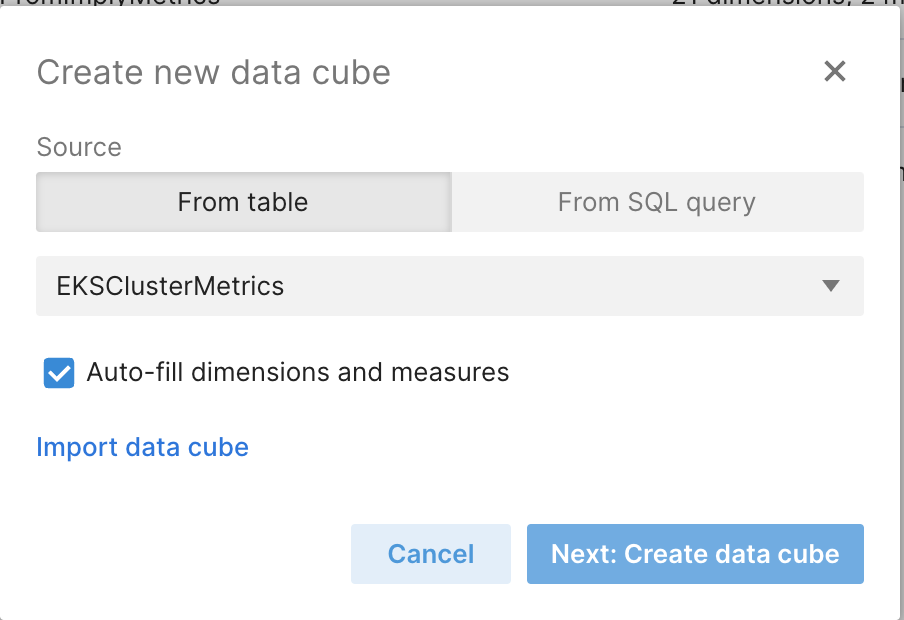
Click on the Tables view and then click the “…” at the end of the line with the EKSClusterMetrics table. Select Create data cube.
In the next dialog, click Next: Create data cube. The default settings will autodiscover dimensions and measures for the cube. This is a quick way to get started.
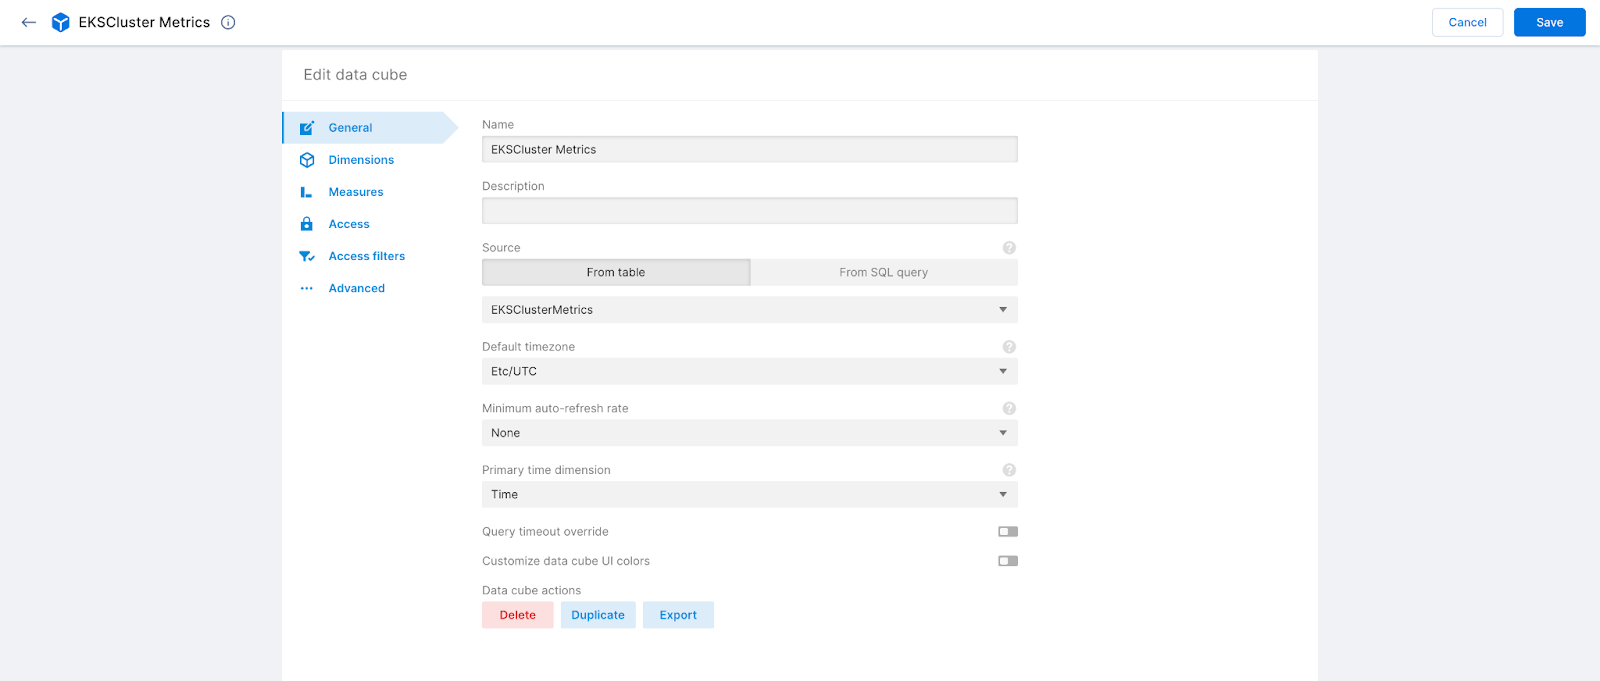
You’ll be taken to the Edit data cube view. Clicking on the Dimensions tab on the top left gives you a list of dimensions that Imply has autodiscovered. The incoming labels can be any cardinality. Feel free to load any data you need to derive your insights. The sky’s the limit!
Also note that the incoming json data has been unnested for you and can be used right away. Go ahead and click Save on the top right.
You’ll be taken to the Data Cube view. Here, you can start slicing and dicing your data. New data from the stream will automatically be incorporated.
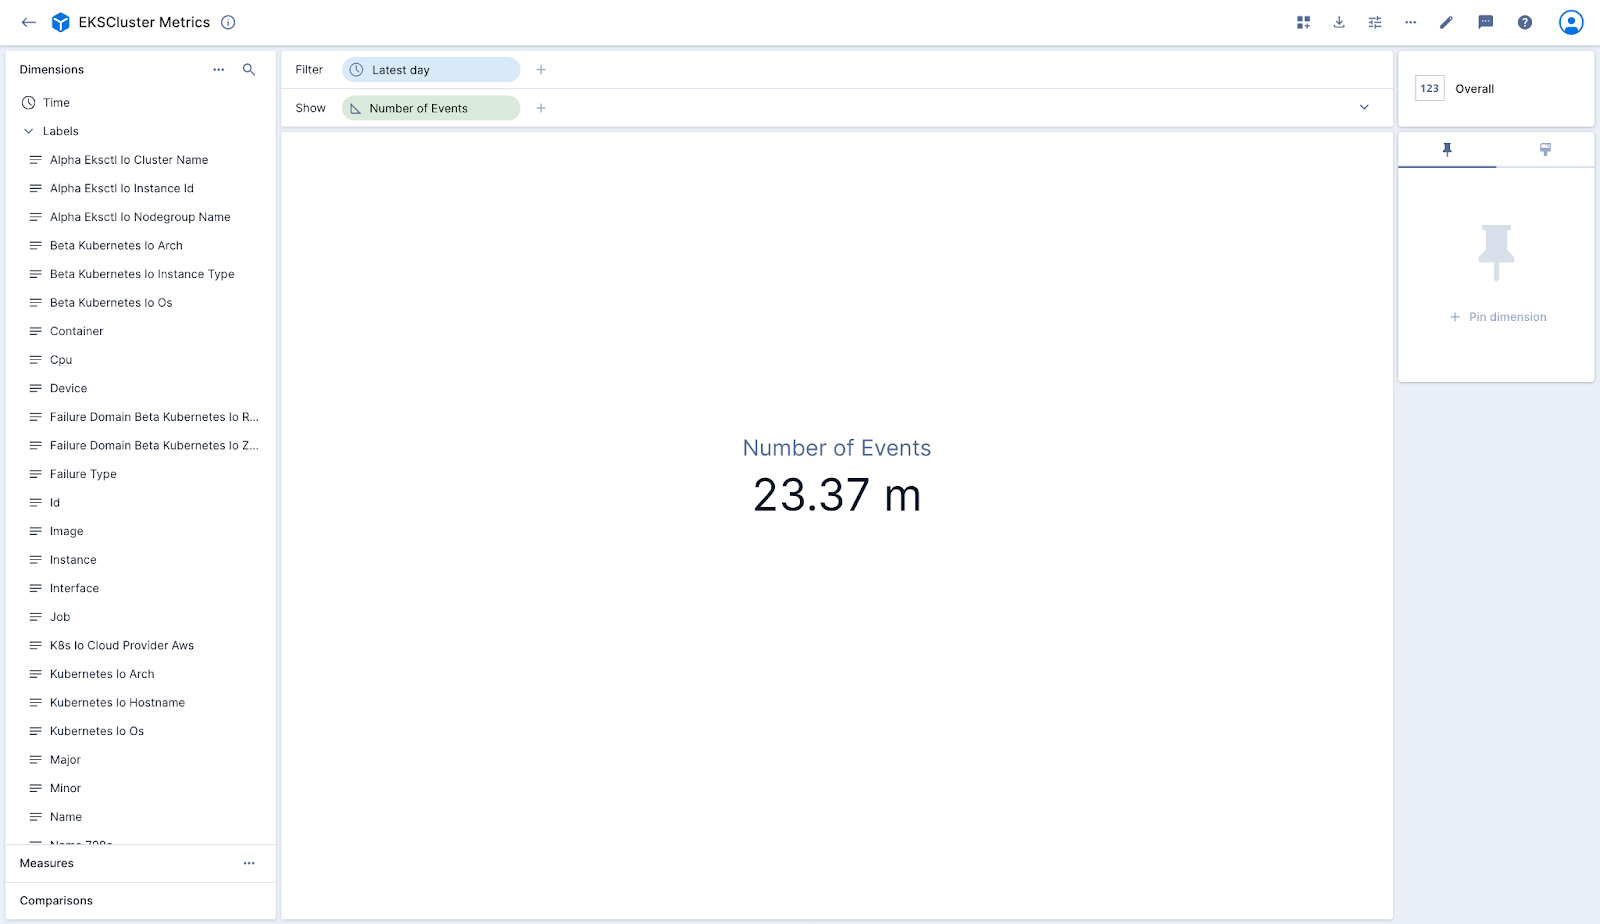
Here are some things to try out:
- Drag the Time dimension to the center rectangular panel then expand the drop zones at the top by clicking on the v toward the top right at the same level as the Show area.
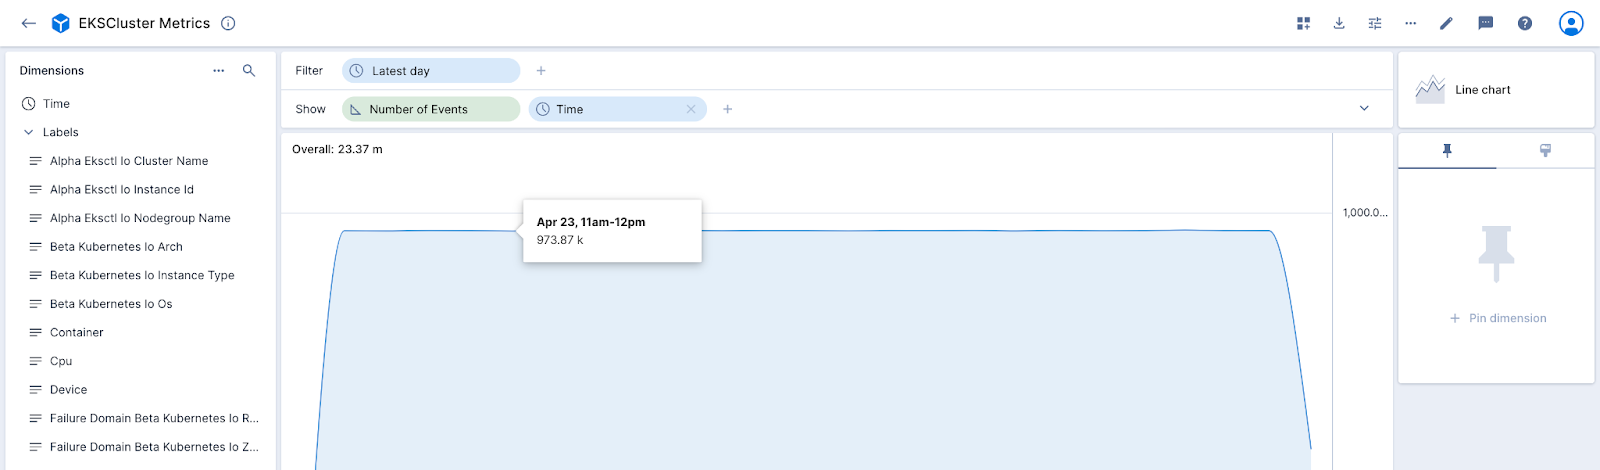
- Drag the Instance dimension and drop it in the Layers drop zone.
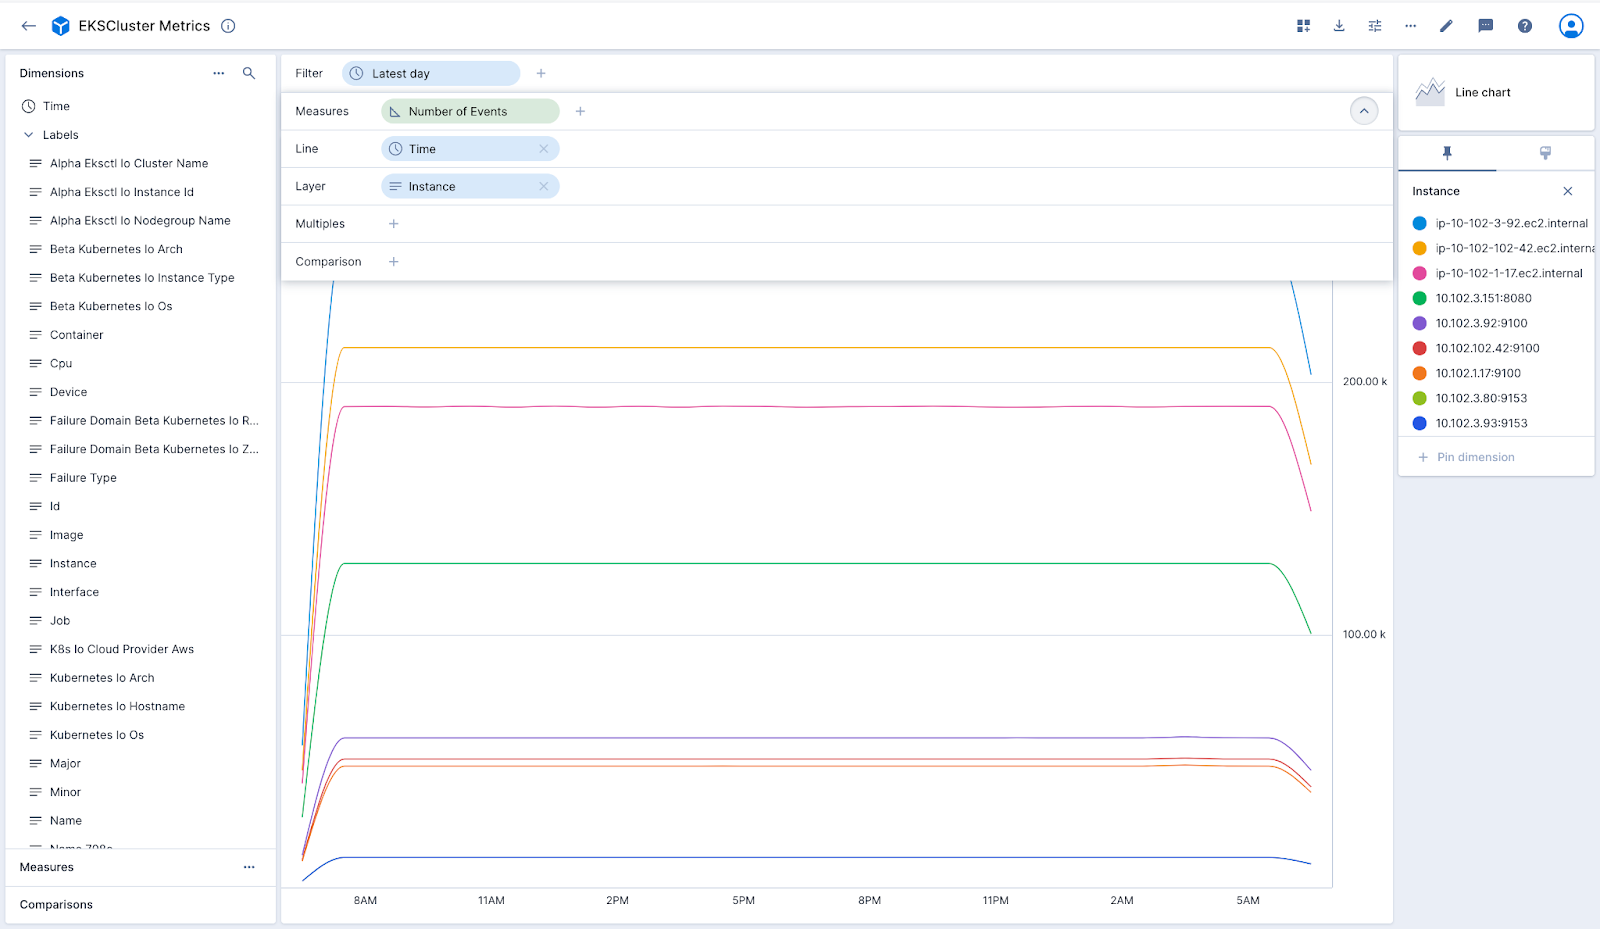
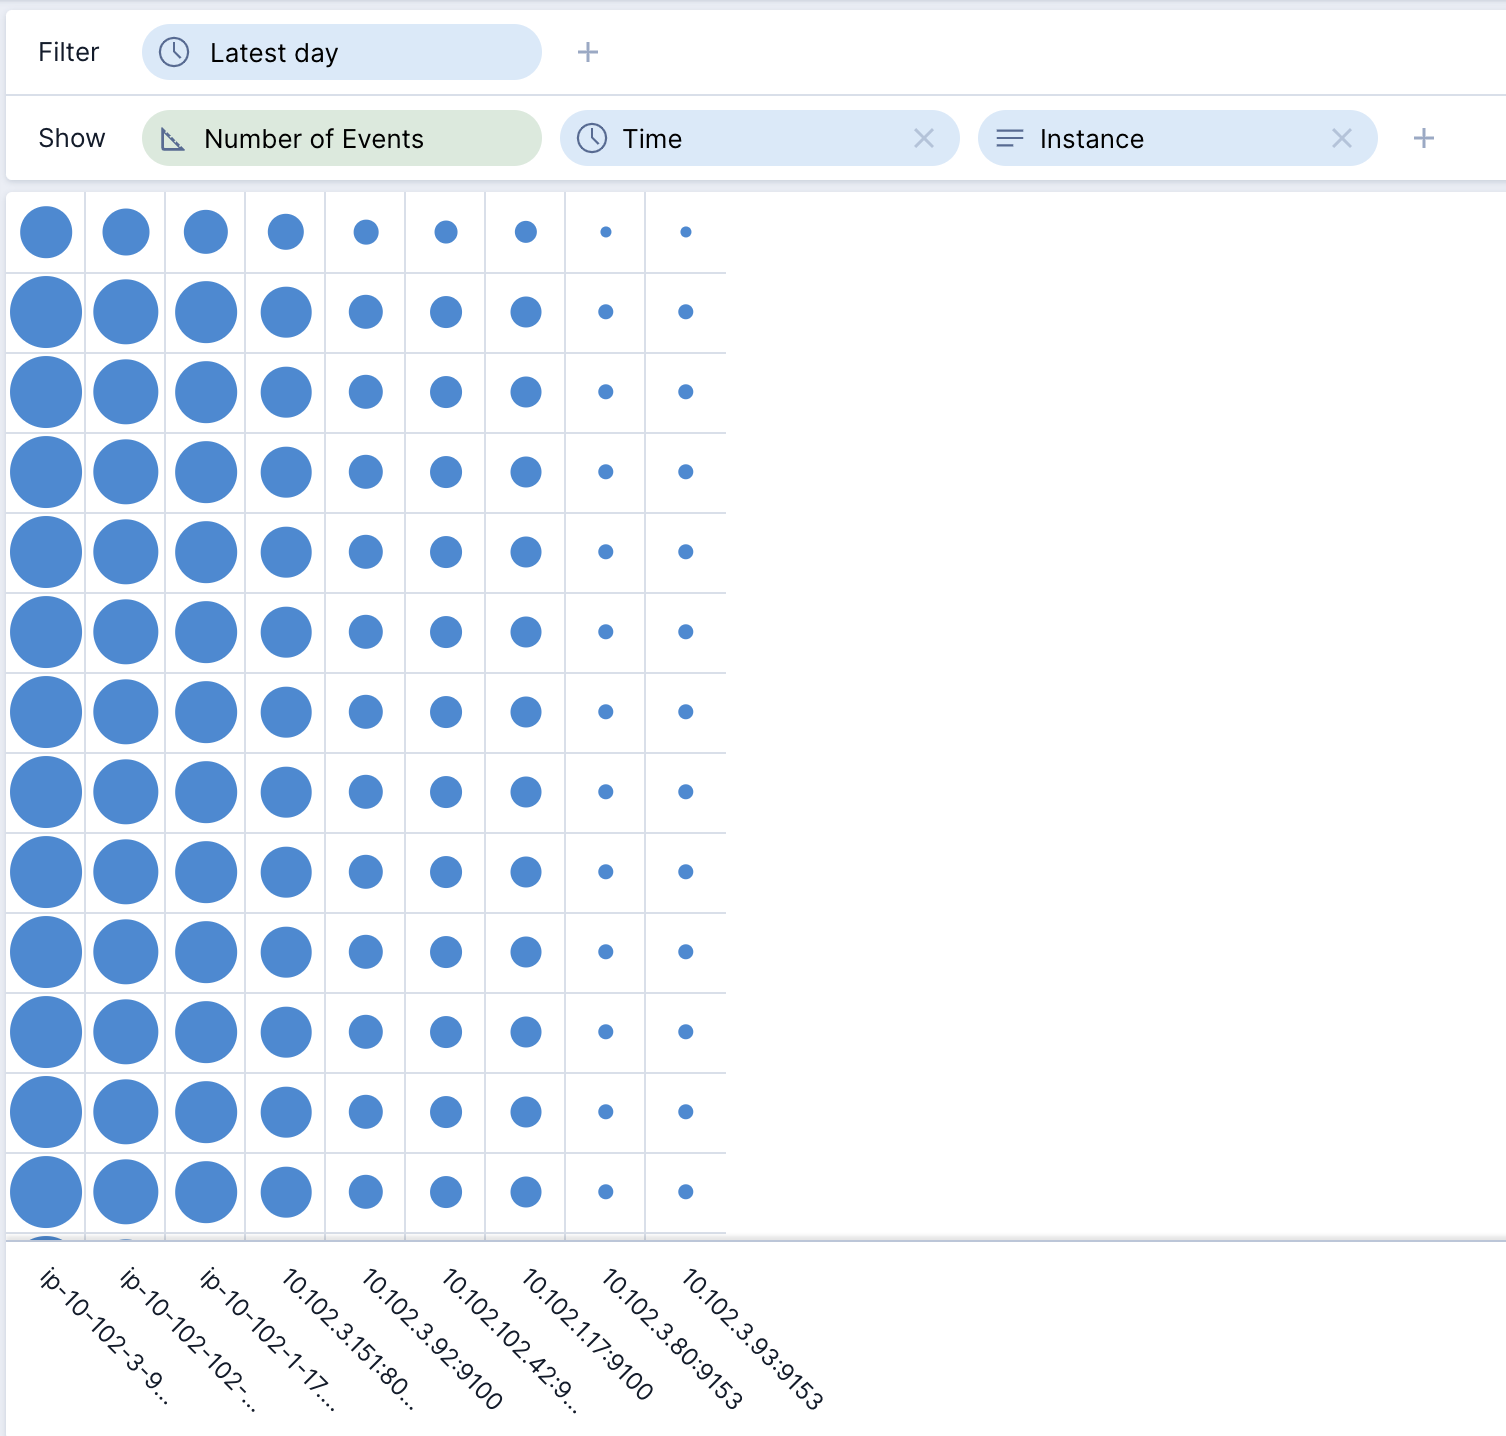
- Collapse the drop zones at the top by clicking on the ^. Try a different visualization, such as a Spot Matrix or Tree Map by clicking on the Line chart words at the top right and changing the visualization.
- Let’s change the visualization back to Table by clicking on the current visualization style at the top right. (That’s Spot matrix in the last screenshot). Select the Table.
- Expand the drop zones at the top by clicking on the v toward the top right. Add high cardinality dimensions to the Columns and Rows. Also, expand the Comparisons from the lower left and add “1 hour back” to the Table by dropping it in the main center rectangle.
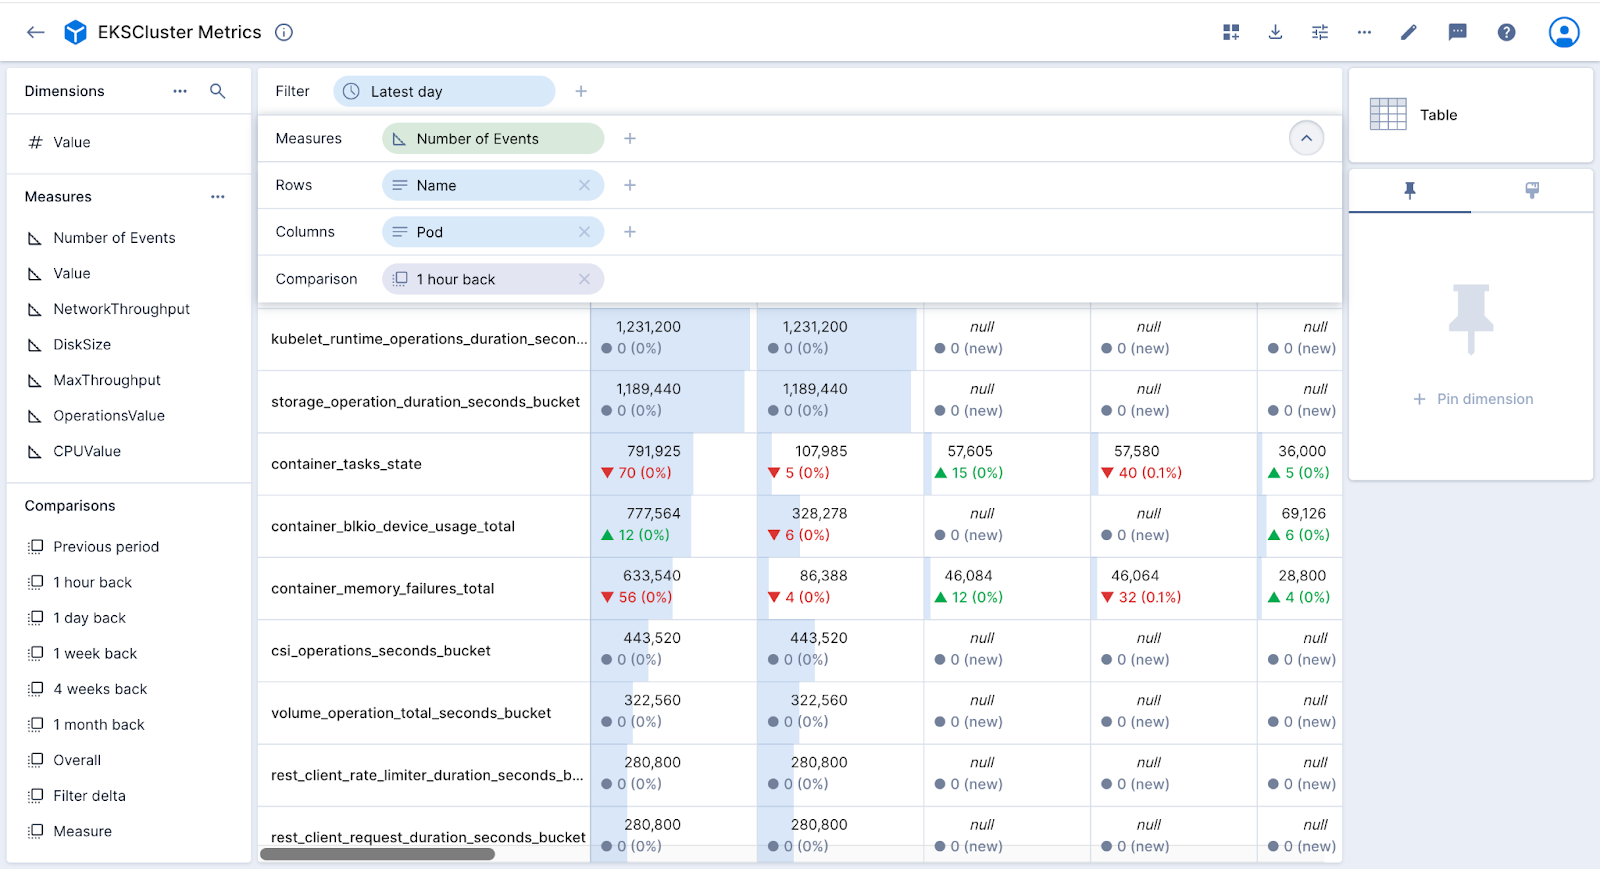
- Notice that you can scroll infinitely down or across without any issues. The interface filters queries sent to the database according to what you can see. As you scroll around, additional queries are issued as needed. You effectively can access an unlimited amount of data.
- Let’s exit out of our cube. It is already saved, and we can set access controls on it. I would now like to use this cube in a dashboard. Go ahead and click on the cube. Add the time dimension as we did before.
- Now I want to incorporate this chart in a dashboard. Click the Add to dashboard button at the top and then select Create new dashboard.
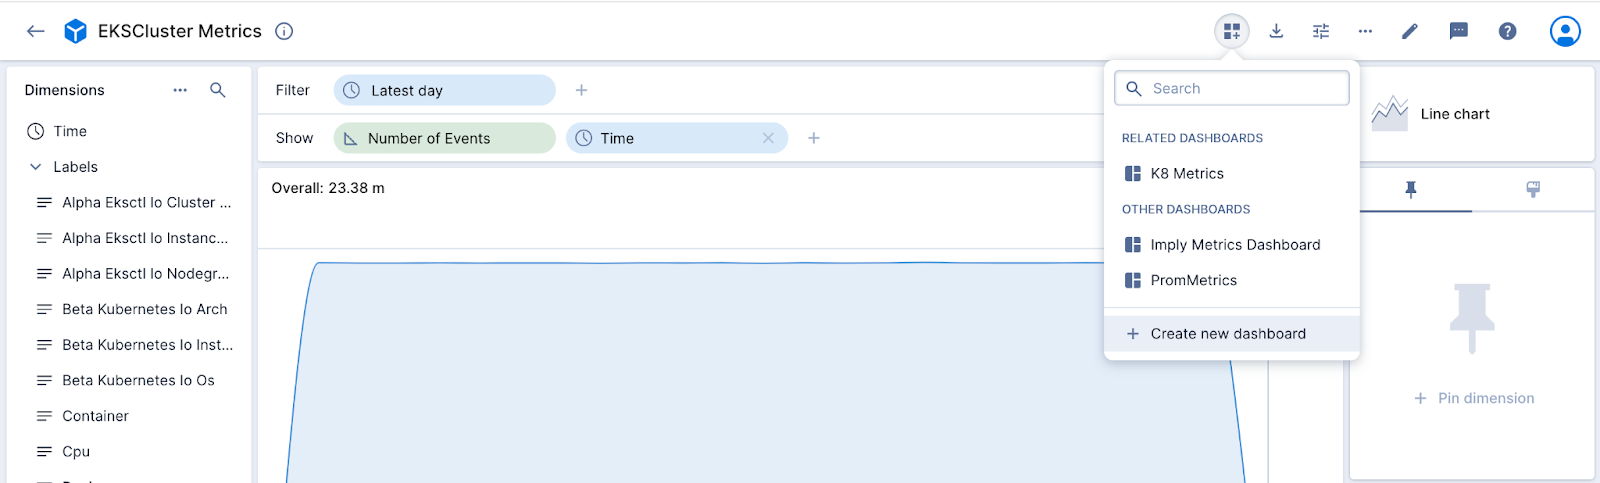
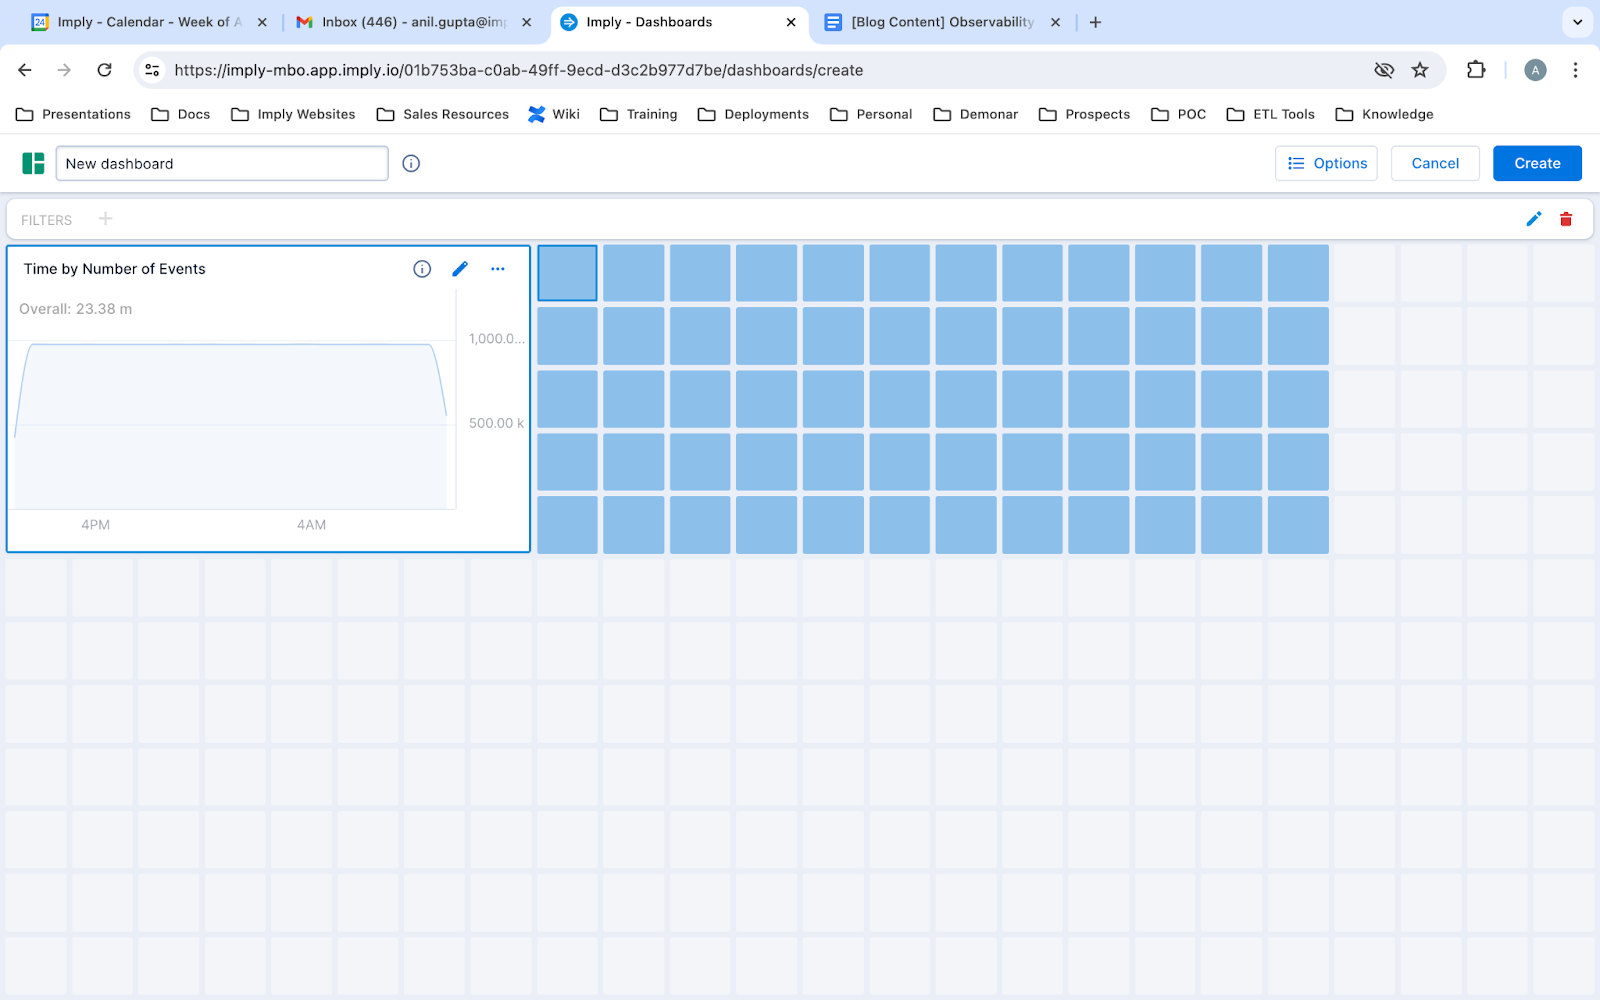
- It pops up in a dashboard view.
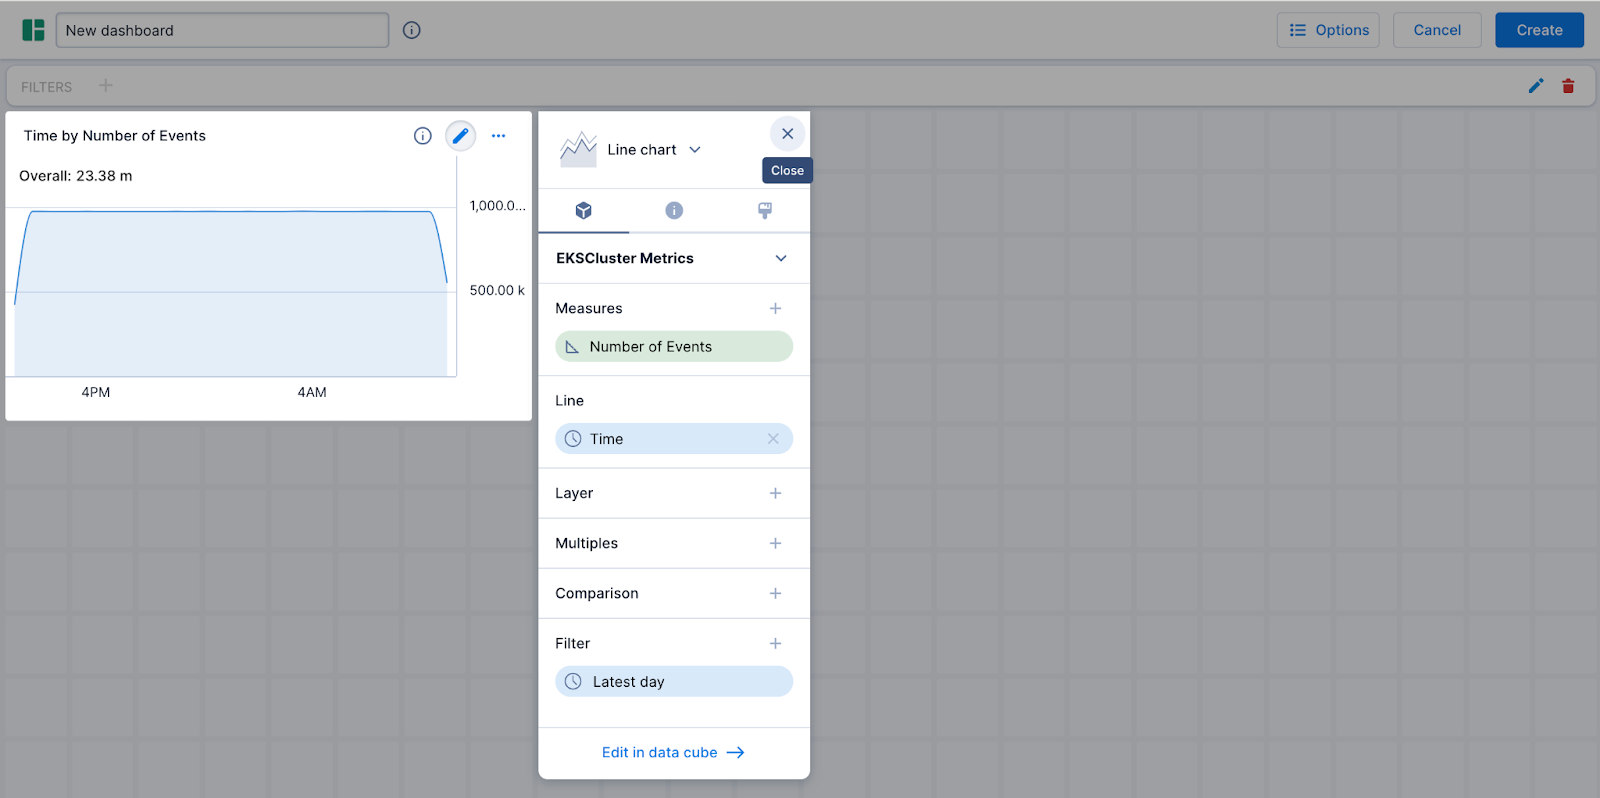
- I am going to add one more visualization (you can have as many as you like). I do this by dragging a rectangle over an area without a visualization.
- You will see that I can choose my visualization as well as my dimensions and measures. Here’s what I came up with.
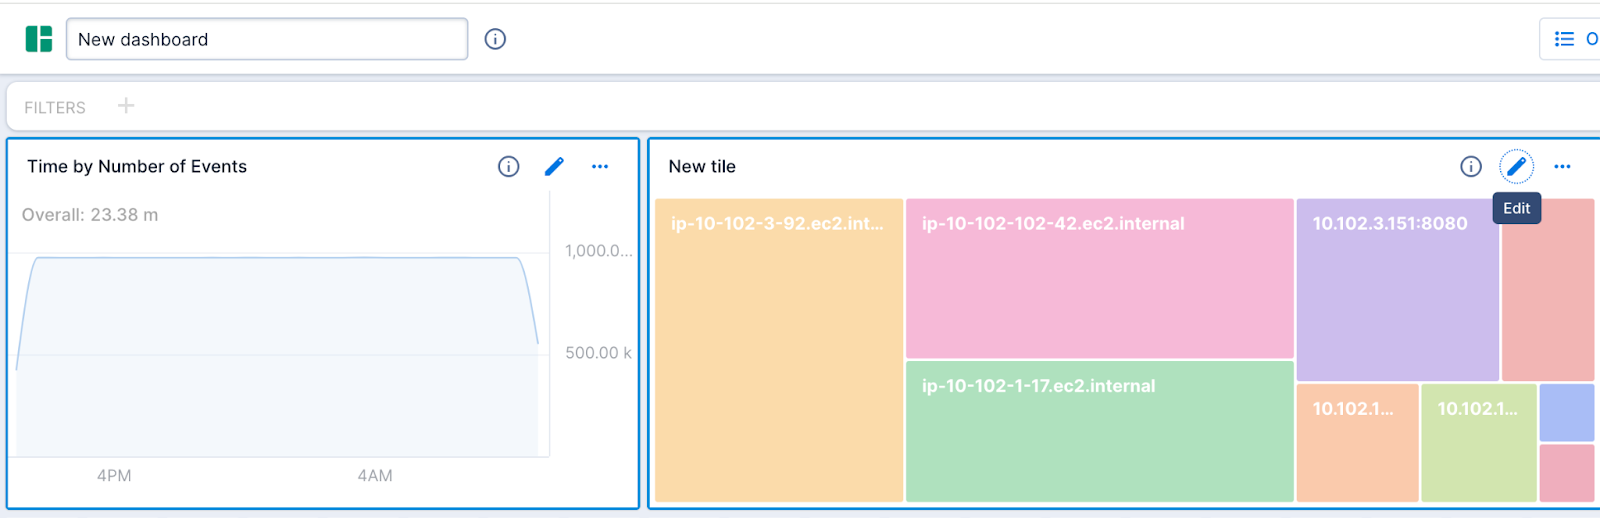
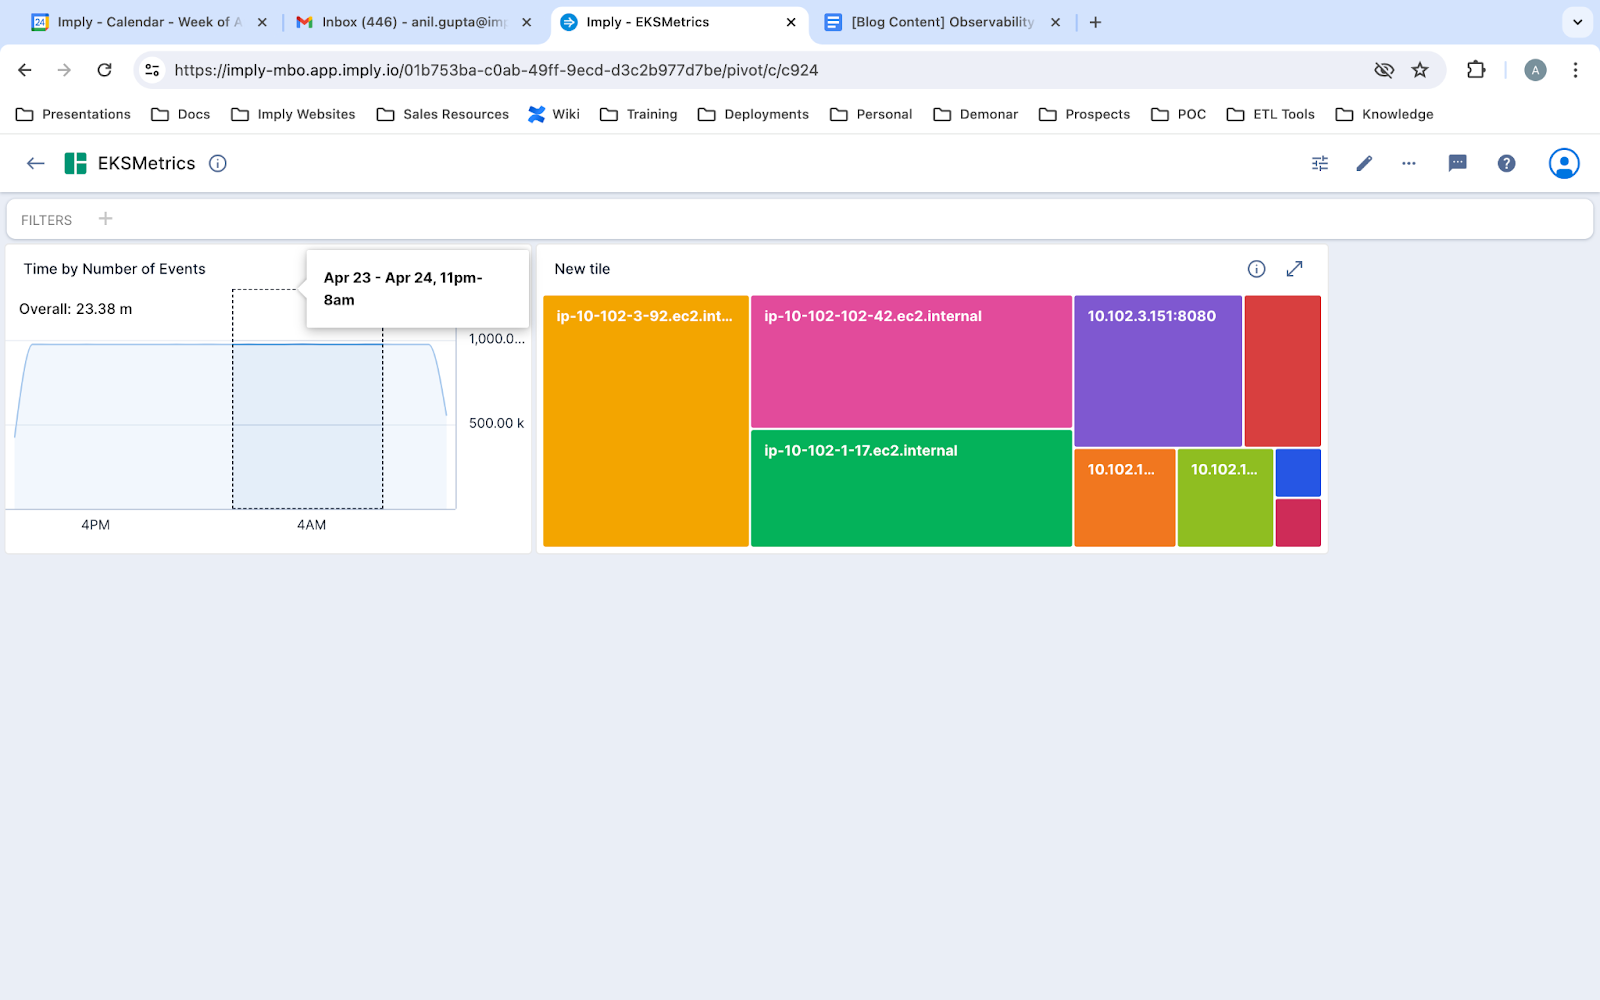
- Now I will replace the name “New dashboard” at the top left with “EKSMetrics”. Then I will click Create. Now you see your dashboard live and fully interactive. For instance, clicking on a rectangle in the heat map will filter the line graph and vice versa. To learn more, read the documentation on creating and managing visualizations.
Conclusion
Congratulations! You now have a fast, highly scalable database for analyzing your metrics. You can keep the data around for months or years (rather than days) and compare what’s happening now to what occurred in the past. You can run subsecond queries and visualizations across terabytes of data or more, enabling you to find issues and drill down to any level of detail for root cause analysis.
Imply Polaris is a quick-to-deploy SaaS database for real-time data. Organizations deploy Druid where they need one or more of the following:
1) Subsecond OLAP queries at any scale of data (GB to PB)
2) High concurrency – several thousands of queries per second are possible
3) Access to realtime data from Kafka or Kinesis, which is often compared to older data.
Learn more about Polaris here, or sign up for a free trial.
 Architecture
 Deployment
 Ingestion
 Modeling
 Operations
 Development


