Authors: Kumar Abhishek & Marc Farnsworth
When building external-facing analytics applications, some common use cases are user behavior monitoring, clickstream analytics, and log analytics (IOT), which are crucial for businesses aiming to make informed decisions and enhance user experiences. By leveraging the power of window functions and Theta Sketches, engineers can build a user interface where analysts (or other business stakeholders) can extract deeper insights from very large volumes of data on precise timeframes.
In this blog, we discuss a gaming analytics use case on Imply (Apache Druid), by exploring how the combination of Window Functions and Theta Sketches unlocks the full potential of these massive, complex datasets.
Architecture and Data Modelling
The below clickstream or log event architecture represents an AWS stack, but could be implemented similarly in any cloud or on-prem environment.
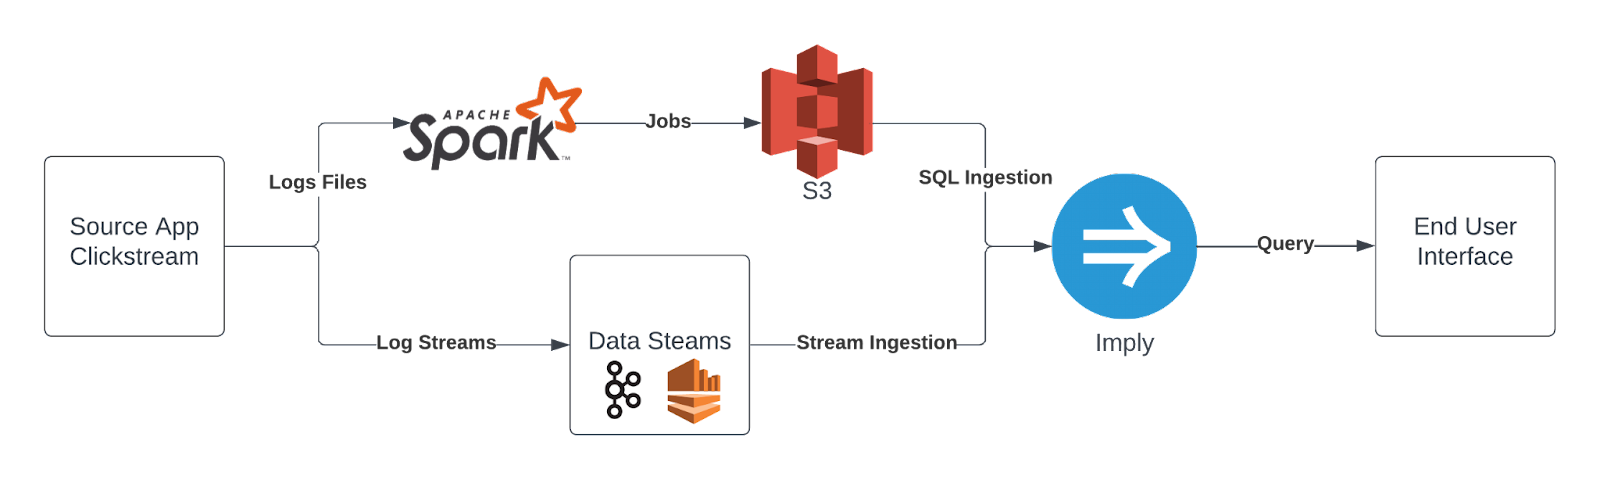
Depending on the source application’s abilities, we see clickstream events (or logs) in both streaming and batch data pipelines.
Good data modeling plays a key role in realizing value from event data. Standard data formats include JSON, CSV, Avro, Parquet, and Protobuf. Depending on the complexity of the data, there are various approaches to address data modeling challenges. At ingestion time with Imply, events can be transformed and filtered. Sometimes, the data is enriched or transformed upstream using Spark or streaming functions or a sequence of Airflow jobs.
How do you design your clickstream or log data model? One approach is to model the data based on application requirements. This involves considering the user interface and the analytics requirement (the queries) and determining the necessary model to support them. Subsequently, you must then identify needed transformations and data enrichment as described above.
Analytics use case: Gamer behavior
Prior to this new solution, the game insights were constrained by fragmented time ranges, and there was inherent difficulty in analyzing such a large volume of data. Other databases that were tested at the time simply couldn’t scale and provide the same functionality as Theta Sketches and window functions.
Let’s review some metrics for our use case:
User Engagement – This metric shows how often and for how long gamers played. The goal is to measure engagement by day, week, or month.
User Retention – This metric helps us determine if gamers return to the app after using it for the first time. Examples of these metrics include a 1-day return rate, a 7-day return rate, and a 30-day return rate.
Now, let’s talk about how Theta Sketches came into play:
In the application, let’s consider our interest in the number of players who played a particular game. For instance, on a given day, 5,000 unique players started playing the game at level 1, while only 1,000 players proceeded to play level 2 of the same game. We may want to explore further trends for that particular game, including:
- How many players played both levels?
- How many players played at least one level?
- How many players only played level 1 but not level 2?
Unfortunately, these questions cannot be answered by looking at aggregated numbers alone. We would need to return to the detailed data and scan every row. If the data volume is sufficiently high, this process may take a considerable amount of time, making interactive data exploration impractical.
This is where Theta Sketches come into play, offering a solution to avoid processing large amounts of data for each query. Instead, Theta Sketches allow us to quickly obtain an approximate estimate for the distinct count of values used to construct the sketches. They are probabilistic data structures that facilitate approximate big data analysis with known error distributions.
So, why bring window functions into the mix?
Window functions can be valuable in a variety of analytics applications, and certainly in the context of game analytics. They provide profound insights into player behavior, game performance, and overall user engagement for a targeted time frame. Here are some key highlights regarding their significance in game analytics:
- By partitioning data into time-based windows, analysts can discern the duration of gaming sessions, identify the most popular times for gameplay, and derive session-specific metrics.
- Window functions facilitate the calculation of retention rates over specific time intervals, offering insights into the number of players who return to the game after their initial session.
- They also enable the calculation of rolling averages, moving sums, and other time-dependent metrics, allowing analysts to identify trends and patterns in player behavior over time.
- With window functions, analysts can pinpoint when players are likely to churn (stop playing) by analyzing specific in-game events or patterns leading up to a player’s disengagement.
Here’s an example syntax for reference, combining window functions with theta sketches:
SELECT
  "region_dimension",
  "time_day_dimension",
  APPROX_COUNT_DISTINCT_DS_THETA ("monthly_user_dimension") as "monthly_user_dimension"
FROM
  (
    SELECT
      "monthly_user_cumulative_dimension".region "region_dimension",
      "monthly_user_cumulative_dimension".__time "time_day_dimension",
      DS_THETA(DS_THETA(users_theta)) OVER (ORDER BY CAST(FLOOR(__time to day) AS BIGINT) RANGE BETWEEN 30 PRECEDING AND 0 FOLLOWING) as "monthly_user_dimension"
    FROM
      (SELECT
          *
        FROM
          druid.gamer_dimension
        WHERE
          1 = 1
          AND game_dimension = '123456'
          AND region_id IN ('0', '100)
      ) AS "monthly_user_cumulative_dimension"
    WHERE
      ("monthly_user_cumulative_dimension".game_dimension = '123456' AND region_id IN ('0', '100))
      AND ("monthly_user_cumulative_dimension".__time > timestampadd(day, -30, time_parse('2023-05-01')) AND "monthly_user_cumulative_dimension".__time <= time_parse('2023-05-31'))
    GROUP BY 1,2
  ) AS "monthly_engagement"
WHERE
    "time_day_dimension" > time_parse('2023-05-01')
    AND "time_day_dimension" <= time_parse('2023-05-31')
GROUP BY 1,2
For more information about using window functions and Theta Sketches, check out the Imply documentation.
 Architecture
 Deployment
 Ingestion
 Modeling
 Operations
 Development


