As Data Analytics Evolves, We Need to Get Real (Time)
Contributing authors: Darin Briskman and Eric Tschetter
We like data! We also like thinking about how to use data to get the insights we crave to accelerate our success – improving health outcomes, getting the right products quickly to the people who need them, increasing opportunity and equity, understanding risks, helping people find the music and games they want, and the millions of other fun and cool things we can do with data.
After over 30 years of working with data analytics, we’ve been witness (and sometimes participant) to three major shifts in how we find insights from data – and now we’re looking at the fourth.
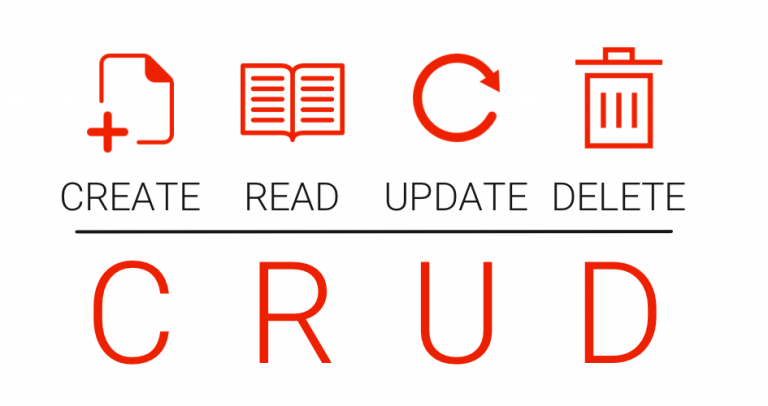
The first shift – Going to CRUD
In the beginning, Codd created the database. And he looked upon it and saw that it was CRUD.
It wasn’t really the beginning, of course. There had been databases for a few decades, using hierarchical and network models that were focused on automating legacy processes that had been done using pens, paper, and mechanical calculators. But when IBM’s Dr. Ted Codd published “A Relational Model of Data for Large Shared Data Banks” in 1970 it kicked off a new era for data, with relational databases as the basis of a data revolution in the 1980s and 1990s, defining the tables with rows and columns that we all use today.

Another group at IBM developed SQL, which made getting data into databases and out of databases much easier. An explosion of relational databases followed, as groups around the world used SQL with Oracle, DB2, Sybase, Ingres, and too many other relational databases to name.
At its core, relational SQL is CRUD: tools to Create, Read, Update, and Delete data. It’s a brilliant approach to make large data sets practical at a time when compute and storage were very expensive – in 1983, when Oracle made its first sale (to the Central Intelligence Agency), a GB of storage cost about $500,000 (in 1983 dollars – that’s about $1.4m today), while a GB of memory cost about $2m ($5.6m today).
To control these costs, CRUD gained a collection of tools to store data more efficiently by breaking data in lots and lots of smaller tables which Dr. Codd named normalization (why? A big news story of the 70s was the US “normalizing” its relationship with China; Codd figured that if Nixon could normalize China, he could normalize data). This added complexity to data management, which means more developer time to work with data. But when a GB of storage is the same price as 5 person-years of developer time, the complexity was considered well worth the price.
Highly normalized CRUD is great for transactions, where you need to input data fast and get answers to simple questions, like “what’s the status of order #8675309?”. As more data became available, people wanted to ask more complex questions, like “what are my 10 most profitable products and how has that changed over the last 8 quarters?”. The answer: analytical databases.
Analytics requires data stored in an analytics-friendly format, with the data at least partially denormalized (fewer, bigger data tables). It became clear that using the same dataset for both transactions and analytics would make both work poorly, so early analytics started by using a second copy of the data on a second installation of the database software.
The second shift – CRUDdy Appliances
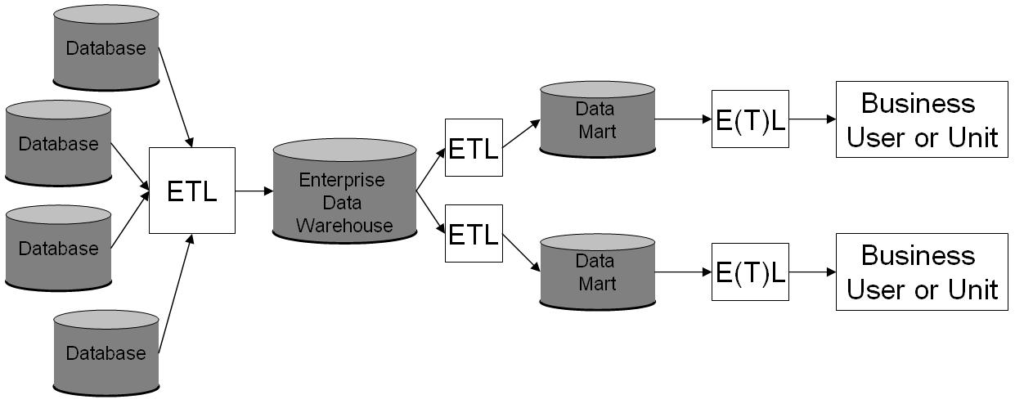
As analytics became more complex, we saw the rise of appliances – dedicated data warehousing hardware + software from Teradata, Netezza, Greenplum, and others. It was still all relational CRUD, with whole new categories of software created to extract data transactional systems (finance, human resources, shipping, supply chain, sales, and such), transform it to a different CRUD schema that is friendly for analytics, and load it into analytic databases, using software from Informatica, IBM, and others. We also saw the rise of business intelligence tools to turn data into pictures and reports that humans can more easily use, like Hyperion, Business Objects, Cognos, and Microstrategy.
This whole data ecosystem was disrupted and reformed, first by the Internet. The Internet radically increased the amount of data created and used. In 1995, a “big application” might be an SAP system with 5,000 users, and a 1TB data warehouse was considered huge. By 2005, “big applications” like Google search, Amazon commerce, and Facebook had millions of users. Pushing this much data through a CRUD pipeline was both too expensive and ineffective. Something new was needed.
The third shift – CRUD in the Cloud
A new generation of analytics databases arose to deal with larger datasets, like Aster Data, Vertica, and ParAccel. As this new generation entered the market, many believed that they would displace data warehousing as we knew it, connecting the new realities of our internet age with the CRUDdy infrastructure of the past. Little did these technologies know that the new realities of the internet age were going to bring about a change that would disrupt their very foundations. The internet brought home a new friend to meet the parents: the Cloud. Life with data changed again.
With effectively unlimited cheap computing power and cheap storage on-demand from Amazon Web Services at first and soon from Microsoft Azure, Google Cloud, and many others, It was now possible to re-design and re-create how to approach analytics. One of the clearest stories of just how much deployment and operations in the cloud was transformational to these databases, we can look at ParAccel. As a technology, it was one of the new-comers in this generation, but was struggling in the marketplace. Then, they formed a partnership with AWS, which took the ParAccel technology and offered it as a service known as Redshift. Redshift took off, opening the door for other cloud-native data warehouses like Google BigQuery and Snowflake, offering high scalability, combined with new cloud-focused data pipeline tools (like Fivetran and Matillion) and business intelligence tools (Looker, Tableau, Domo, Apache Superset, and others) to redefine the data warehouse.
Of course, Cloud Computing also powered the rapid growth of applications, as not just Internet giants but a wide range of businesses and governments found themselves operating applications with millions or dozens of millions of users. Pushing this much data through a CRUDdy pipeline just takes too long and costs too much.
As we entered the 2010s, data engineers were struggling with this problem. How can we have interactive conversations with high-volume data? The data streams in from the Internet and other applications – why not just analyze the data stream instead of converting it all to relational CRUD?
The need for a Modern Database
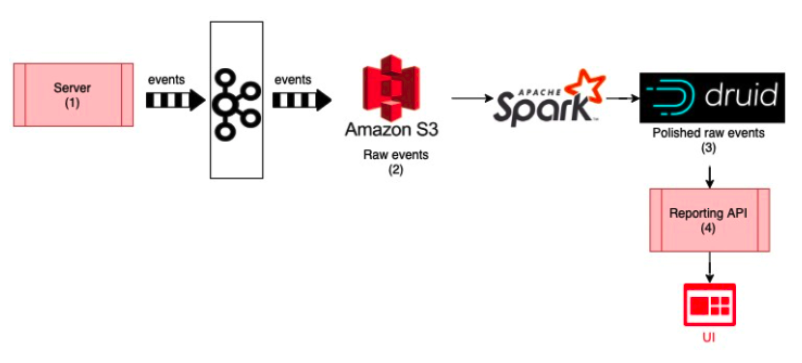
We can find a great example of how this shift to powering analytical applications shows up in the real world by looking at Reddit. They explain in a blog post (https://www.redditinc.com/blog/scaling-reporting-at-reddit/) how they need to expose direct insights into the effectiveness of their advertising and just couldn’t do it without new database options.
Reddit advertisements generate tens of gigabytes of event data per hour. To let advertisers both understand their impact and decide how to target their spending, Reddit needs to enable interactive queries across the last six months of data – hundreds of billions of raw events to sift through!
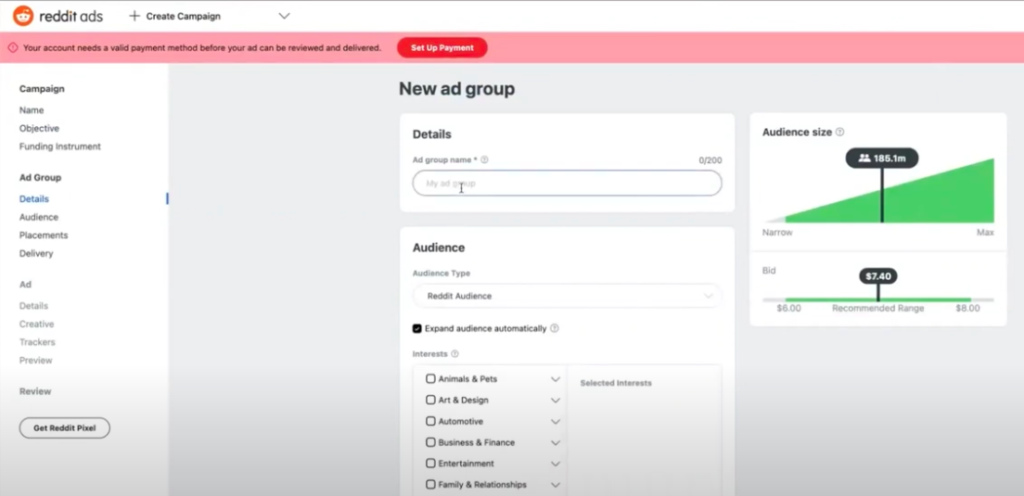
Reddit needs to empower advertisers to see groups and sizes in real time, adjusting based on interests (sports, art, movies, technology …) and locations to find how many redittors fit their target.
(There’s a detailed explanation of this on YouTube)
Here we see the changes required by modern analytics applications: large numbers of people (in this case, advertisers) conducting interactive conversations with large, fast moving data sets that combine new data from streams with historical data.
The fourth shift – Beyond CRUD
As you might have noticed from the Reddit example, there is a new database hiding in this solution: Druid.
As the need to stream analytics emerged, several projects tried different approaches to make it work. One advertising technology company needed a database that could combine stream analytics (for high-volume incoming data) with historical data (stored as relational CRUD) and found that every existing technology was either too slow, not scalable enough, or too expensive for their needs. Since they needed a database that could shift “shape” to address both streaming and historic data, and they had grown up playing Dungeons & Dragons, the new database was named after the D&D druid, a sort of shapeshifting magician.

Druid became an open source project under the Apache Foundation in 2013, and was quickly adopted by a wide range of people looking to analyze streams or a combination of stream data and historical data. Druid became a leader in the field of real-time databases, and, over time, several companies were created to help developers use Apache Druid®, led by Imply Data, founded by Druid’s co-creators.
To make something like this work, you need subsecond response times for questions from billions of data points, some in streams and some in historical datasets. Concurrency is also paramount, as there may be dozens or hundreds or more people asking questions of the data at the same time. And, of course, it needs to be done on a budget, where value delivered greatly outweighs the cost of operation.
While storage and computing still cost money, in modern development they are far far smaller than the cost of developer time – compute power is now a few dollars per hour, while object storage costs $23/TB per month or less. Meanwhile, the full-laden cost of a US developer, including salary, benefits, equipment, and management, is $55 – $80 per hour. Developer time (and, once the application is deployed, similar costs for administrators to operate it) are by far the greatest expense. In modern economics, if you spend an hour of a single developer’s or administrator’s time a day to save a TB of storage, you are losing over $100,000 per year.
The Path Forward – Still some CRUD, but also Modernity
We have entered a new age, and CRUD is no longer enough.
There are still good uses for analytics with relational CRUD. Most organizations still need annual and quarterly reporting, if only to meet regulatory requirements. This sort of “not real time” reporting works well with CRUD.
For teams to have meaningful interactive conversations with data, modern real-time databases are key. It just takes too long and costs too much to push all the data through the CRUD data pipeline.
If you are a developer or a professional with an interest in data, I strongly suggest you take a look at the real-time databases now available. For me, the one with the best combination of support and capabilities is Imply Enterprise, which is built using Apache Druid, adding technical support and packages for easy deployment to automate scaling and operations. But whatever you choose, be ready to take your team beyond CRUD and embrace modernity!
© 2022 Imply. All rights reserved. Imply and the Imply logo, are trademarks of Imply Data, Inc. in the U.S. and/or other countries. Apache, Apache Druid, Druid and the Druid logo are either registered trademarks or trademarks of the Apache Software Foundation in the USA and/or other countries. All other marks are the property of their respective owners.
 Architecture
 Deployment
 Ingestion
 Modeling
 Operations
 Development


