There’s that saying “patience is a virtue”. But, in today’s day and age no one really wants to wait for anything. Is Netflix taking too long to load? Users will switch. Is the nearest Lyft too far? Users will switch.
That need for immediacy is also happening in data analytics, and it’s happening at scale on large data sets. The ability to deliver insights, make decisions and act on real-time data without users waiting (or requiring patience) is increasingly important. Companies like Netflix and Lyft but also Confluent and Target and 1000s of others are leaders in their industries in part because of real-time analytics and the data architectures that enable real-time, analytics-driven operations.
For data architects who are starting to think about real-time analytics, this blog unpacks what they are and the building blocks and data architecture that are preferred by many.
What are real-time analytics?
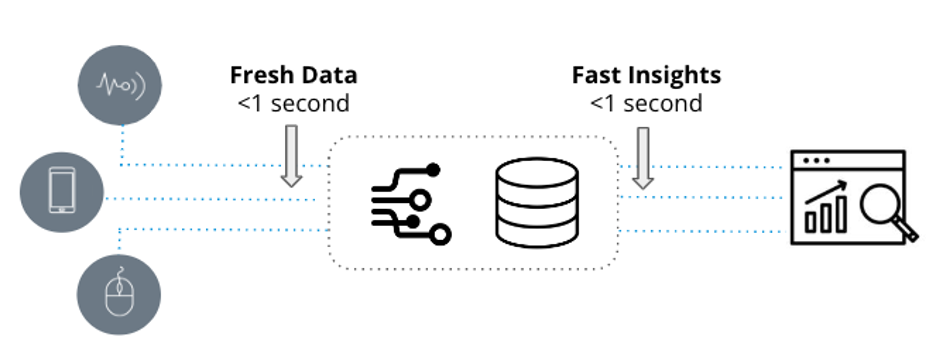
Real-time analytics are defined by two key attributes: fresh data and fast insights. They are used in latency-sensitive applications when it’s essential that new event-to-insight is measured in seconds.

Figure: Real-time analytics defined
In comparison, traditional analytics, which also goes by business intelligence, are static snapshots of business data used for reporting purposes and are powered by data warehouses like Snowflake and Amazon Redshift and visualized through BI tools such as Tableau or PowerBI.
While traditional analytics are built from historical data that can be hours, days, or weeks old, real-time analytics utilize recent data and are used in operational workflows that demand very fast answers to potentially complex questions.
| Traditional Analytics | Real-Time Analytics |
|
|
Figure: Decision criteria for real-time analytics
For example, a supply chain executive is looking for historical trends on monthly inventory changes: traditional analytics is perfect here. Why? Because the exec can probably wait a few minutes longer for the report to process. Alternatively, a security operations team is looking to identify and diagnose anomalies in network traffic. That’s a fit for real-time analytics as the SecOps team needs to rapidly mine thousands to millions of real-time log entries in sub-second to spot trends and investigate abnormal behavior.
Does the right architecture matter?
A lot of database vendors will say they’re good for real-time analytics and they are…to a degree. Take for example weather monitoring. Let’s say the use case calls for sampling temperature every second across 1000s of weather stations with queries that include threshold-based alerts and some trend analysis. This would be easy for SingleStore, InfluxDB, MongoDB, even PostgreSQL. Write a push API that sends the metrics directly to the database and then a simple query gets executed and voila…real-time analytics.
So when do real-time analytics actually get hard? In the example above, the data set is pretty small and the analytics are pretty simple. A single temperature event is only generated once every second and a SELECT with WHERE statement to capture the latest events doesn’t require much processing power. Easy for any time-series or OLTP database.
Things start getting challenging and pushing the limits of databases when the volume of events ingested gets higher, the queries involve a lot of dimensions, and data sets are in the terabytes (if not petabytes). Apache Cassandra might come to mind for high throughput ingestion. But analytics performance wouldn’t be great. Maybe the analytics use case calls for joining multiple real-time data sources at scale. What to do then?
Here are some considerations to think about that’ll help define the requirements for the right architecture:
- Are you working with high events per second, from 1000s to millions?
- Is it important to minimize latency between events created to when they can be queried?
- Is your total dataset large, and not just a few GB?
- How important is query performance – sub-second or minutes per query?
- How complicated are the queries, exporting a few rows or large scale aggregations?
- Is avoiding downtime of the data stream and analytics engine important?
- Are you trying to join multiple event streams for analysis?
- Do you need to place real-time data in context with historical data?
- Do you anticipate many concurrent queries?
If any of these things matter, let’s talk about what that right architecture looks like.
Building blocks
Real-time analytics needs more than a capable database. It starts with needing to connect, deliver, and manage real-time data. That brings us to the first building block: event streaming.
1. Event streaming
When real-time matters, batch-based data pipelines take too long and that’s why messaging queues emerged. Traditionally, delivering messages involved tools like ActiveMQ, RabbitMQ, and TIBCO. But the new way is event streaming with Apache Kafka and Amazon Kinesis.
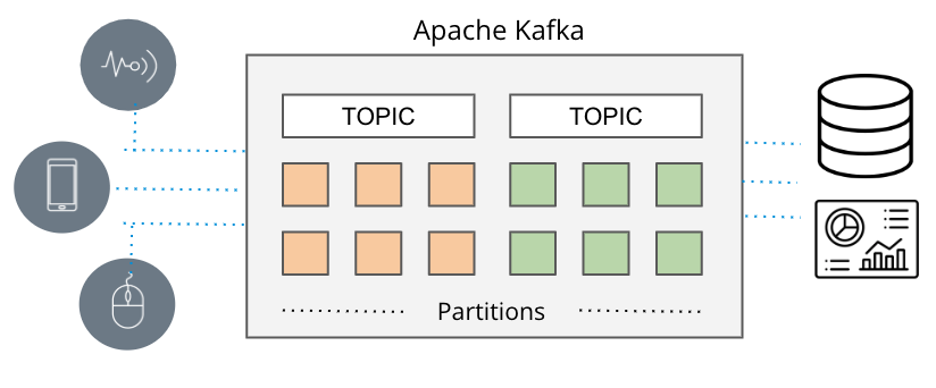
Apache Kafka and Amazon Kinesis overcome the scale limitations of traditional messaging queues, enabling high throughput pub/sub to collect and deliver large streams of event data from a variety of sources (Amazon lingo: producers) to a variety of sinks (Amazon lingo: consumers) in real-time.

Figure: Apache Kafka event streaming pipeline
Those systems capture data in real-time from sources like databases, sensors, and cloud services in the form of event streams and deliver them to other applications, databases, and services.
Because the systems can scale (Apache Kafka at LinkedIn supports over 7 trillion messages a day) and handle multiple, concurrent data sources, event streaming has become the de facto delivery vehicle when applications need real-time data.
So now that we can capture real-time data, how do we go about analyzing it in real-time?
2. Real-time analytics database
Real-time analytics need a purpose-built database, a database that can take full advantage of streaming data in Apache Kafka and Amazon Kinesis and deliver insights in real-time. That’s Apache Druid.
As a high-performance, real-time analytics database built for streaming data, Apache Druid has become the database-of-choice for building real-time analytics applications. It supports true stream ingestion and handles large aggregations on TBs to PBs of data at sub-second performance under load. And since it has a native integration with Apache Kafka and Amazon Kinesis it makes it the go-to choice whenever fast insights on fresh data is needed.
Scale, latency, and data quality are all important when selecting the analytics database for streaming data. Can it handle the full-scale of event streaming? Can it ingest and correlate multiple Kafka topics (or Kinesis shards)? Can it support event-based ingestion? Can it avoid data loss or duplicates in the event of a disruption? Apache Druid can do all of that and more.
Druid was designed from the outset for rapid ingestion and immediate querying of events on arrival. For streaming data, it ingests event-by-event, not a series of batch data files sent sequentially to mimic a stream. There’s no connectors to Kafka or Kinesis needed and Druid supports exactly-once semantics to ensure data quality.
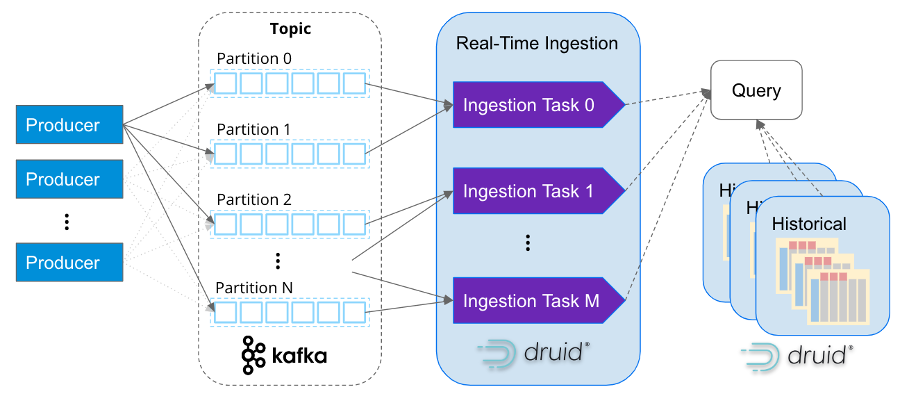
Just like how Apache Kafka was built for internet-scale event data, Apache Druid was too. Its services-based architecture independently scales ingestion and query processing practically infinitely. Druid maps ingestion tasks with Kafka partitions, so as Kafka clusters scale Druid can scale right alongside it.

Figure: How Druid’s real-time ingestion is as scalable as Kafka
It’s not that uncommon to see companies ingesting millions of events per second into Druid. For example, Confluent – the originators behind Kafka – built their observability platform with Druid and ingests over 5 million events per second from Kafka.
But real-time analytics needs more than just real-time data. Making sense of real-time patterns and behavior requires correlating historical data. One of Druid’s strengths, as shown in the diagram above, is its ability to both support real-time and historical insights via a single SQL query with Druid managing up to PBs of data efficiently in the background.
So when you pull this all together you end up with a very scalable data architecture for real-time analytics. It’s the architecture 1000s of data architects choose when high scalability, low latency, and complex aggregations are needed from real-time data.

Figure: Data architecture for real-time analytics
Example: How Netflix Ensures a High-Quality Experience
Real-time analytics plays a key role in Netflix’s ability to deliver a consistently great experience for more than 200 million users enjoying 250 million hours of content every day. Netflix built an observability application for real-time monitoring of over 300 million devices.

Figure: Netflix’s real-time analytics architecture. Credit: Netflix
Using real-time logs from playback devices streamed through Apache Kafka and then ingested event-by-event into Apache Druid, Netflix is able to derive measurements that understand and quantify how user devices are handling browsing and playback.
With over 2 million events per second and subsecond queries across 1.5 trillion rows, Netflix engineers are able to pinpoint anomalies within their infrastructure, endpoint activity, and content flow.
Parth Brahmbhatt, Senior Software Engineer, Netflix summarizes it best:
“Druid is our choice for anything where you need subsecond latency, any user interactive dashboarding, any reporting where you expect somebody on the other end to actually be waiting for a response. If you want super fast, low latency, less than a second, that’s when we recommend Druid.”
Conclusion
If you’re looking to build real-time analytics, I’d highly recommend checking out Apache Druid along with Apache Kafka and Amazon Kinesis. You can download Apache Druid from druid.apache.org or simply try out Imply Polaris, the cloud database service for Apache Druid, for free.
 Architecture
 Deployment
 Ingestion
 Modeling
 Operations
 Development


