Apache Druid is a high performance, real-time analytics database that delivers subsecond queries on streaming and batch data at scale and under load. However, users may observe slow-running queries due to several potential reasons:
- Undersized broker/historical nodes for high query concurrency
- Occasional complex queries needing more CPU
- Queries trying to fetch huge volumes of data
- Uncompacted segments leading to poor partitioning
- Sub-optimal data model leading to bad query performance (opportunities for optimisation strategies like using rollup, range partitioning, thetasketches, etc.)
- Sub-optimal queries lacking time boundaries or limits
Imply customers can use Clarity to perform root cause analysis on a cluster experiencing query performance issues. But in certain cases, there might be a need to debug further and take a look at the actual queries being run to get a better idea of the root cause.
You might wonder if there’s a way to identify which of the above is the actual problem. The solution is the Broker Log Parser (BLP), a tool built by the Imply team.
How the Broker Log Parser (BLP) works
Broker logs have the details of all the queries running on a cluster. The BLP takes the broker logs as input and parses them to produce a CSV file with all the helpful columns, such as QueryId, Query Duration, Filters and many more. One of the columns shows the actual query, which can be very helpful when investigating specific query details.
Important points to keep in mind about the BLP:
- The BLP is an open source tool available here.
- The Imply team regularly adds new functionalities to the tool to make it more helpful. Contributions from the community, including customers, are welcome via pull requests (PR).
- Currently, the BLP supports the broker logs extracted from an Imply Hybrid cluster broker. Imply Enterprise logs may be in a different format, requiring adjustments to the BLP script.
Where to get started
Let’s walk through the process using a demo cluster as an example.
1. SSH into the query node to download the broker logs
- After SSHing into the query node, navigate to the logs folder. Imply Hybrid logs can be found under /mnt/var/sv directory
- You should see directories for logs from broker, pivot and router here.
- Create a tar for all the archived and current broker logs
cd /mnt/var/sv
tar -zcvf broker-logs-1.tar.gz broker/@* broker/current- SCP the tar archive to your local machine where you plan to run the BLP script.
- Extract the tar archive file on your local machine.
- Repeat the above steps to get broker logs from all your query nodes.
2. Parse the logs using the Broker Log Parser
BrokerLogParser.py
- You can use the `BrokerLogParser.py` script directly if you are only looking to parse one log file.
- The -i argument accepts the path to the input file, and -o accepts the path and name for the output CSV file to be generated.
Example:
python3 BrokerLogParser.py -i /Users/ravintrivedi/Documents/blp-demo/broker/@4000000065a4fde329dd6e1c.s -o /Users/ravintrivedi/Documents/blp-demo/broker/blp-output.csvRunOnFolder.py
- If you have a directory with multiple logs to be parsed (as in this example), you can use the RunOnFolder.py script.
- The -i argument accepts the path to the input directory where all broker logs are located, and -o accepts the path for the directory where the resulting parsed CSV files should be generated. The script will create the output directory if it doesn’t exist.
Example:
python3 RunOnFolder.py -i /Users/ravintrivedi/Documents/blp-demo/broker -o /Users/ravintrivedi/Documents/blp-demo/blp-outputYou should now have the csv files generated by the script, as in the example below.
As of the time of publication, the list of columns parsed from the logs includes:
- eventtime
- querytype
- datasource
- queryid
- priority
- recency
- duration
- queryTime
- queryBytes
- success
- filters
- aggregations
- implyUser
- query
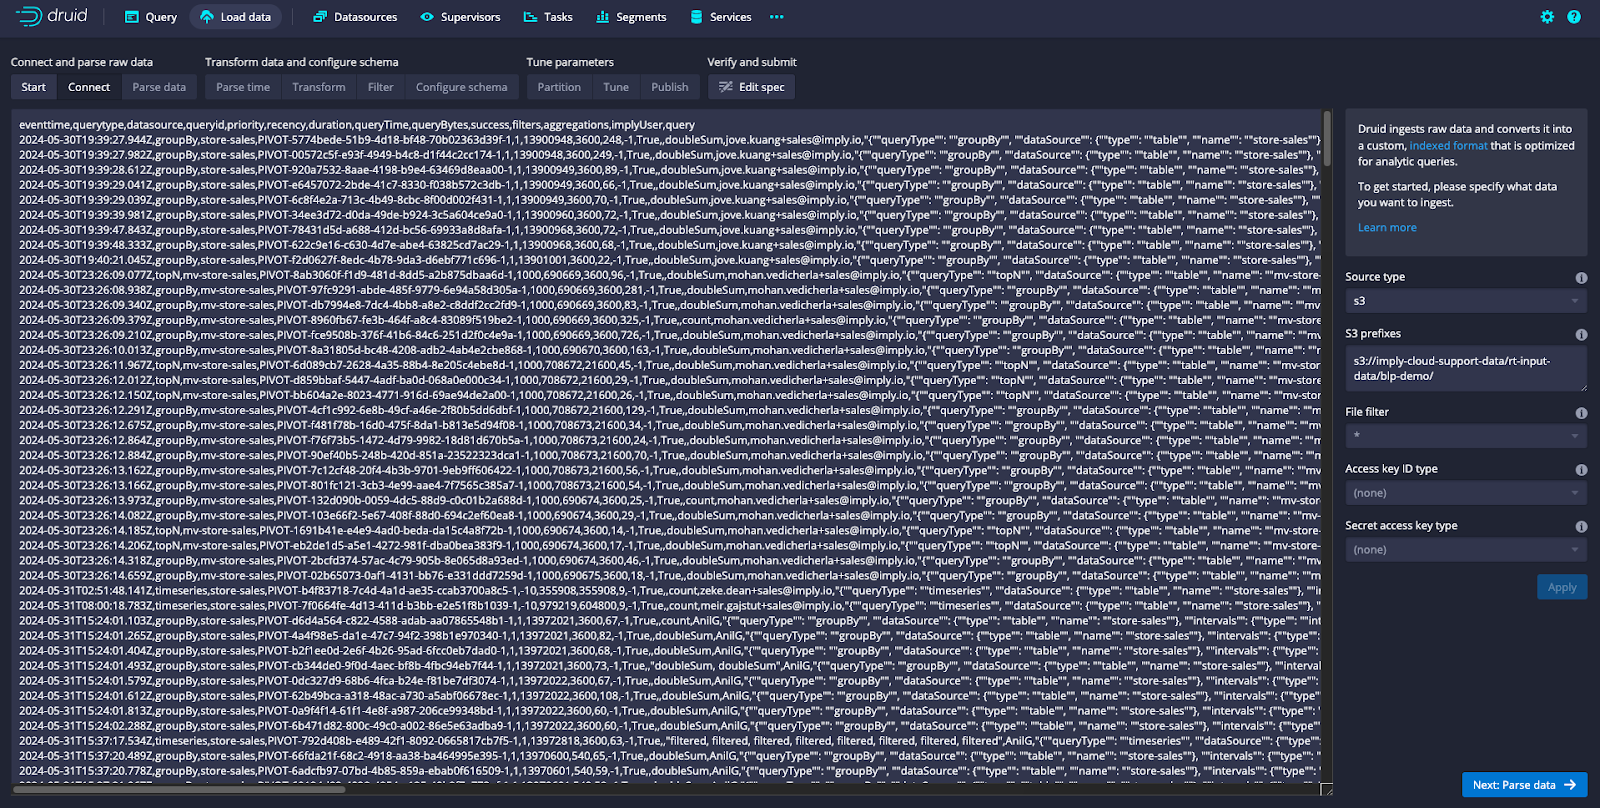
4. Ingest and analyze parsed files in Imply
I use S3 to stage the files and run a batch ingestion into my Imply Hybrid cluster.
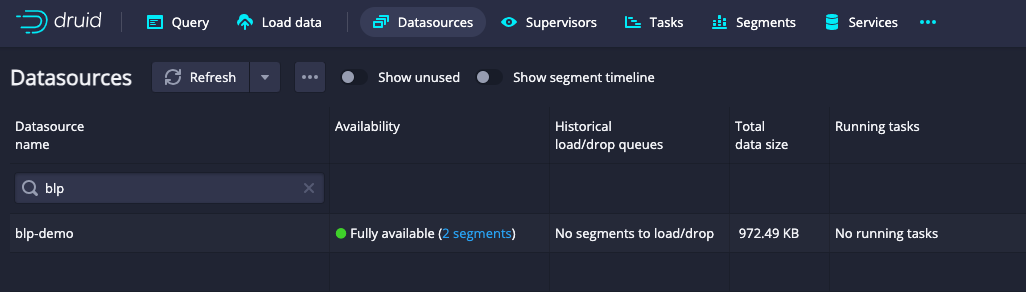
Once the datasource is available, you can move on to analysis. You can create your own datacube, or choose to import a pre-built datacube and dashboard from the BLP git repo by going into Pivot settings.
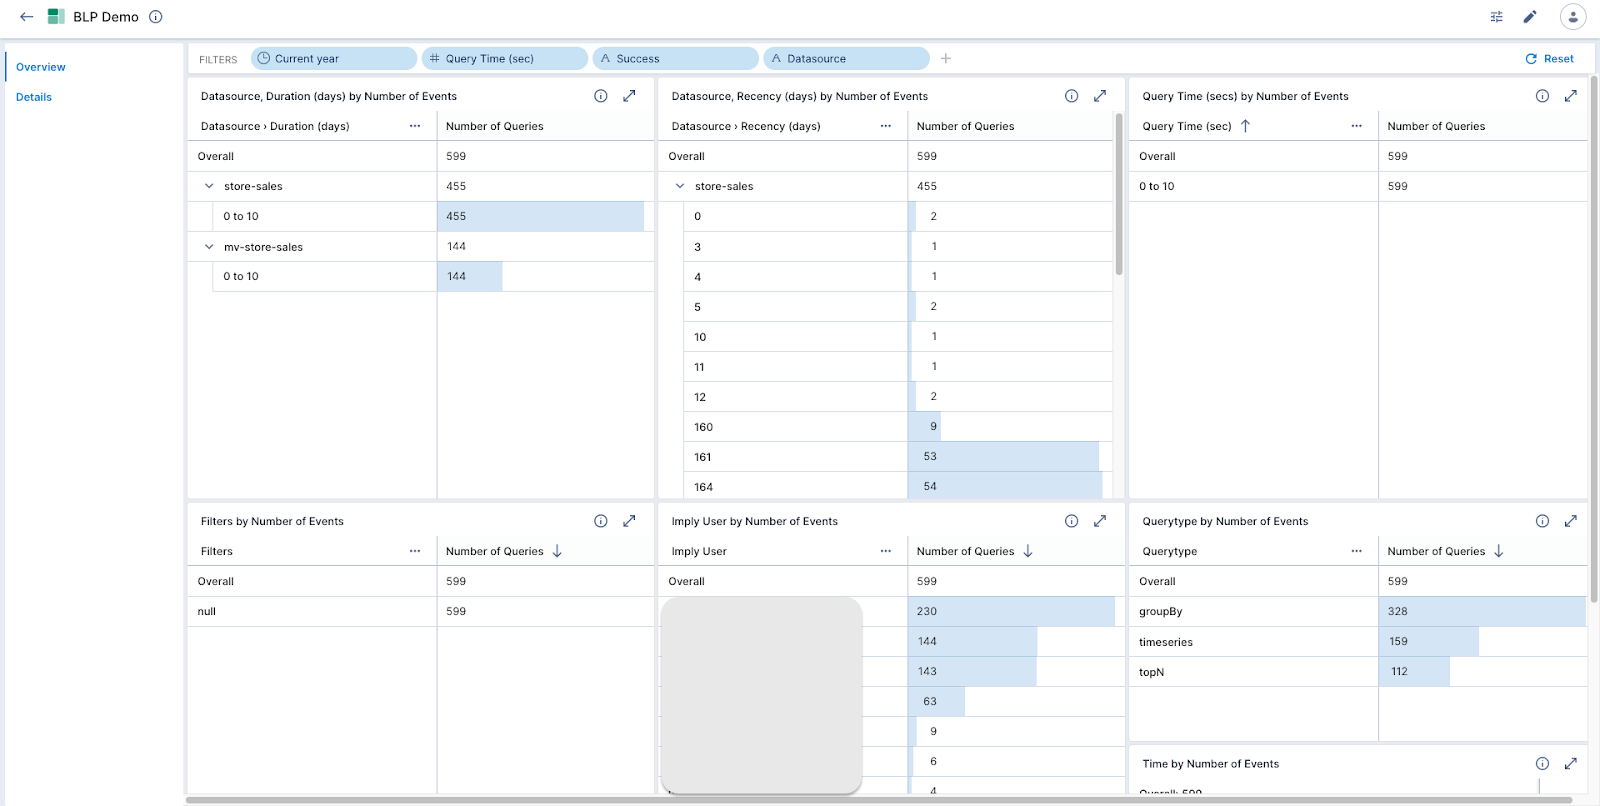
You should now be ready to begin query pattern analysis. Import or build a dashboard to view queries by duration, recency, latency, and type. This will give you an immediate understanding of any slow-running queries. Below is an example of such a dashboard.
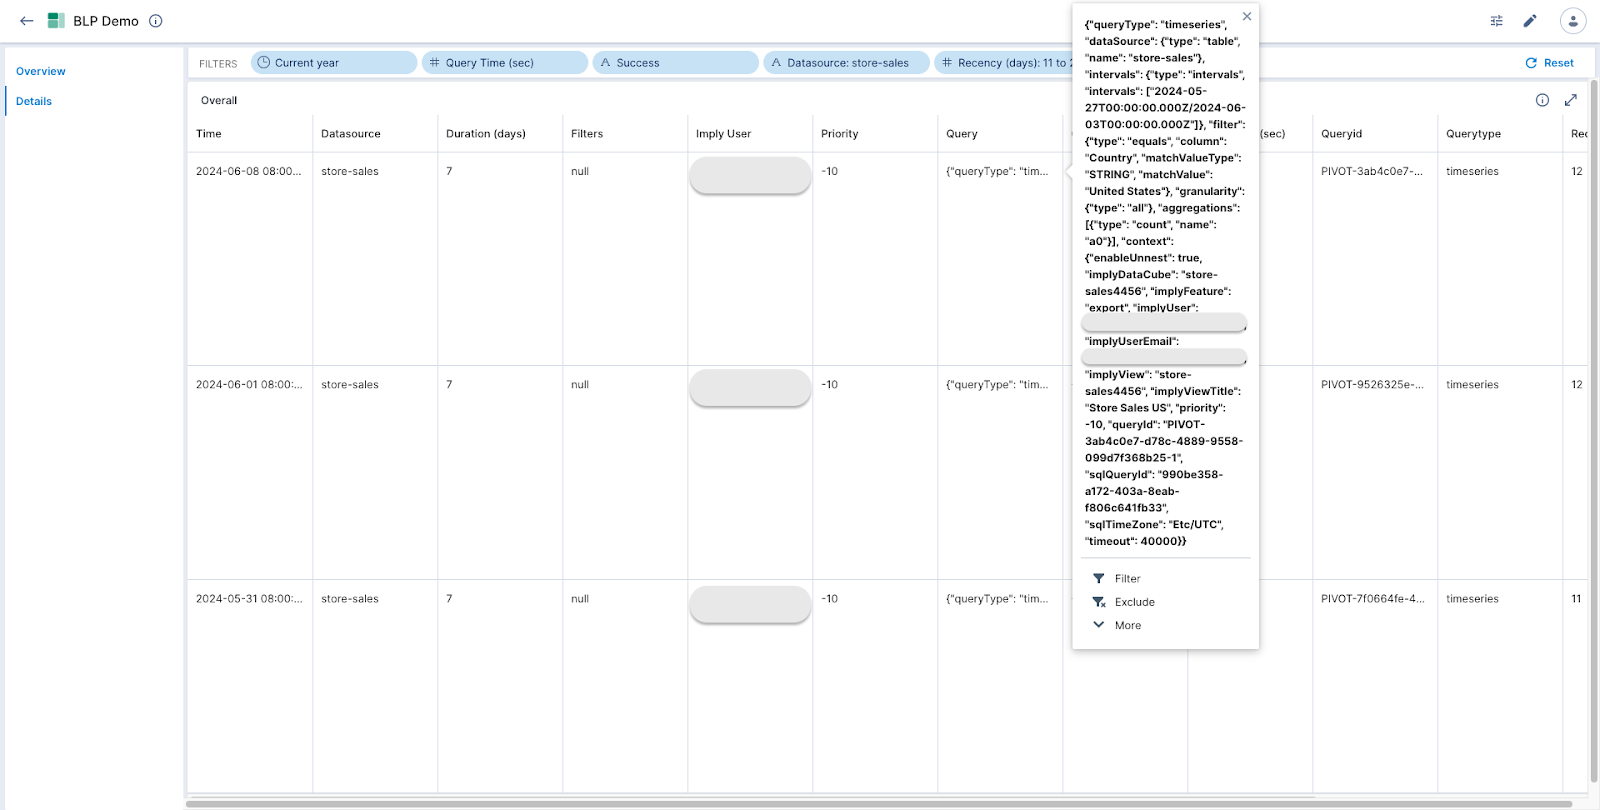
Slicing and dicing as well as filtering can be done on this dashboard to identify the slow-running queries. For example, if I want to see queries that are requesting data that is 11 to 20 days old, I would apply a filter as below.
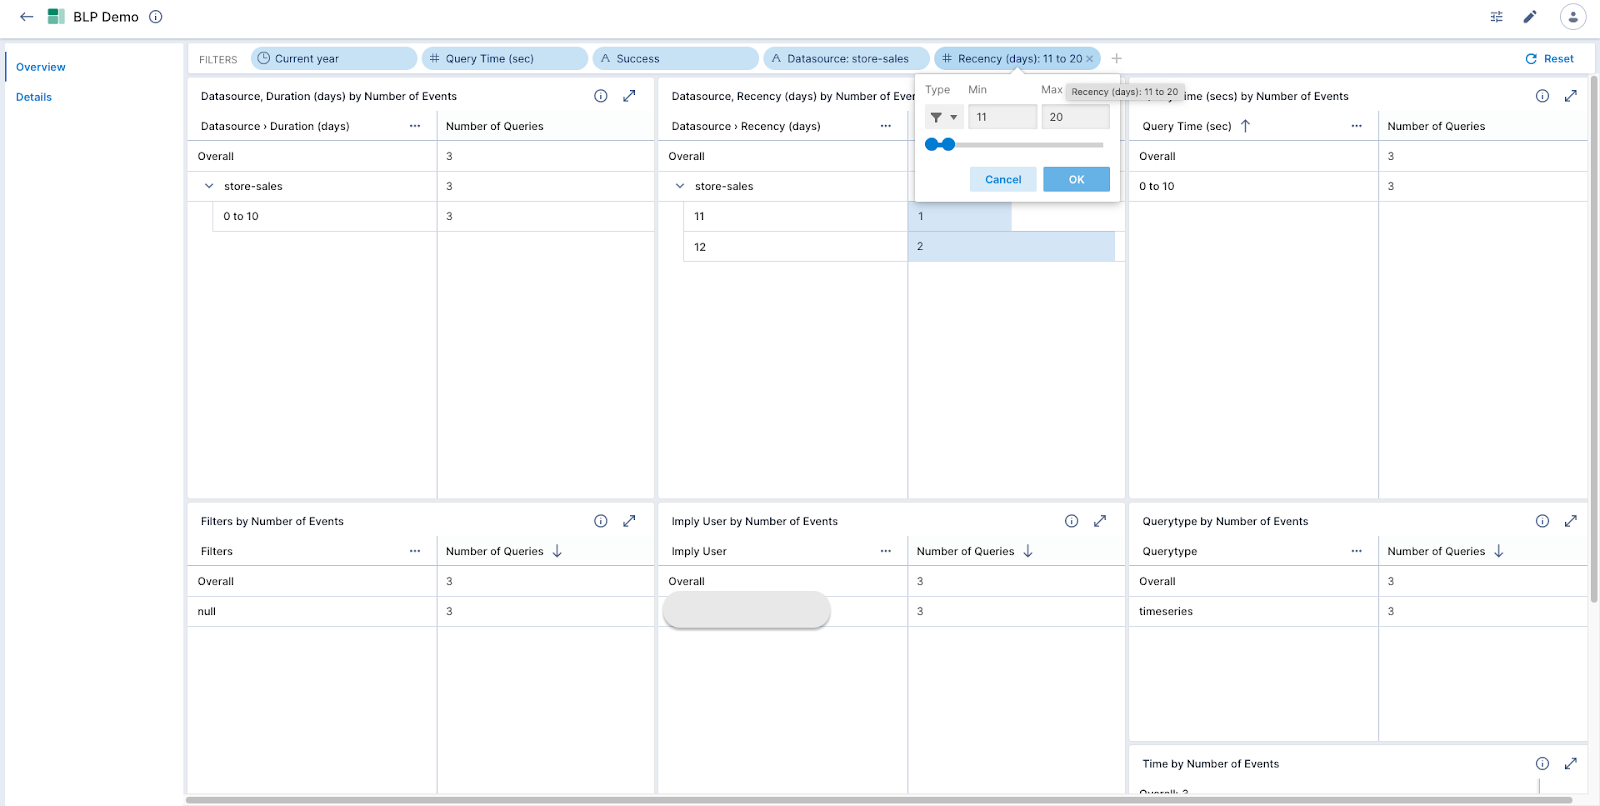
Then, the Details page can be used to get the exact query and its corresponding details.
Conclusion
The Broker Log Parser (BLP) is a very useful tool for diagnosing and resolving query performance issues in Apache Druid. By leveraging the detailed insights provided by the BLP, you can pinpoint the root causes of slow-running queries and implement the necessary optimizations.
Whether you are dealing with complex queries, sub-optimal data models, or other performance bottlenecks, the BLP helps you gain a clear understanding of your query patterns, enabling you to maintain the high performance expected from your Imply Hybrid clusters.
 Architecture
 Deployment
 Ingestion
 Modeling
 Operations
 Development


