May 13, 2024
Tuning into Success: Streaming Music Done the Imply Way
Learn how a top streaming music service uses Imply to provide visibility into audience engagement and other key metrics.
Learn MoreA large part of what we do at Imply is help organizations build custom applications and visualizations on top of their data.While Druid is a powerful backend for powering applications, there are aspects of the development process that could definitely be easier. To enable people to better understand the power of Druid, we have released Pivot, an exploration UI that makes the most of the power of the Druid database.
Pivot is an intuitive UI designed to enable exploratory analytics on event data, and provides a way to perform OLAP operations using a friendly drag-and-drop UI. Pivot is built with the open-source Plywood library,and also borrows some of its terminology.
So, what has led us to build yet another data visualization tool, even though there are plenty out there? There were several motivators:
Data interaction in Pivot is centered around two operations: Filter and Split.
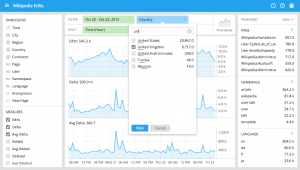
A Filter is equivalent to the WHERE clause in SQL, and involves narrowing the view of data to examine in a query.For example, you may want to filter only on events that occurred in a particular region.
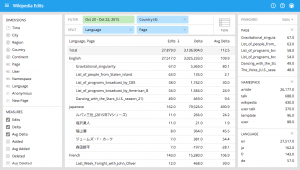
A Split is equivalent to SQL’s GROUP BY, and involves slicing data across a particular attribute or dimension.In Pivot, you can split across multiple dimensions. For example, you can view the top values of a particular dimension,and for each of the values of the first dimension, view the top values based on a second dimension. So here we see the top countries for each of the top languages:
Having selected your dimensions of interest, you will probably want to see them visualized appropriately.Pivot will go ahead and guess the right visualization for your selection, but you can always change it from the visualization menu.
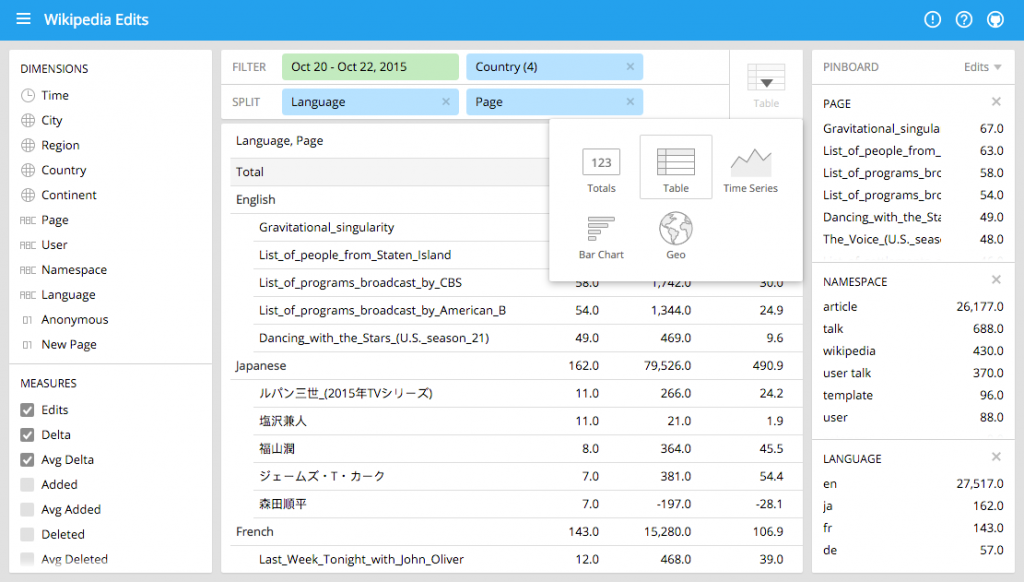
Note that Bar Chart and Geo are in fact not yet available. Oops 🙂 We are working to bring them in soon though, as well as other visualization options.
Pivot is designed to provide a quick and easy way to get insights from a Druid cluster. After installing Pivot you can just point it at your Druid cluster and start exploring your data. Pivot will introspect Druid data sources and auto configure itself as best as it can. Please note that the introspection is a bit lacking at the moment, and will be improved significantly with Druid 0.8.2. If Pivot looks promising to you, you can also provide an explicit configuration that ideally suits your needs. You can learn more about configuration in the GitHub readme.
Pivot comes bundled with the Imply Analytics Platform.The project is still at an alpha stage, and we are working hard to make it robust and add features. If you have feedback – great! Please post it in the User Group.For contribution or any other matter, feel free to contact us.
Tuning into Success: Streaming Music Done the Imply Way
Learn how a top streaming music service uses Imply to provide visibility into audience engagement and other key metrics.
Learn MoreImply Polaris is now on Microsoft Azure
We are thrilled to announce that Imply Polaris is now available on Microsoft Azure! Now, organizations can power their real-time analytics applications with Druid-powered Polaris clusters hosted in Microsoft...
Learn MoreA Builder’s Guide to Security Analytics
When should you build, and when should you buy a security analytics platform? Read on about the challenges, use cases, and opportunities of doing so—and what database you’ll need.
Learn More